
Buying
Land Transfer Tax in Toronto and Ontario, With Examples
Ontario and Toronto land transfer tax rates, first-time buyer refunds, and worked examples at $700K, $1M and $1.3M, with every step of the math shown.
Updated 6 min read
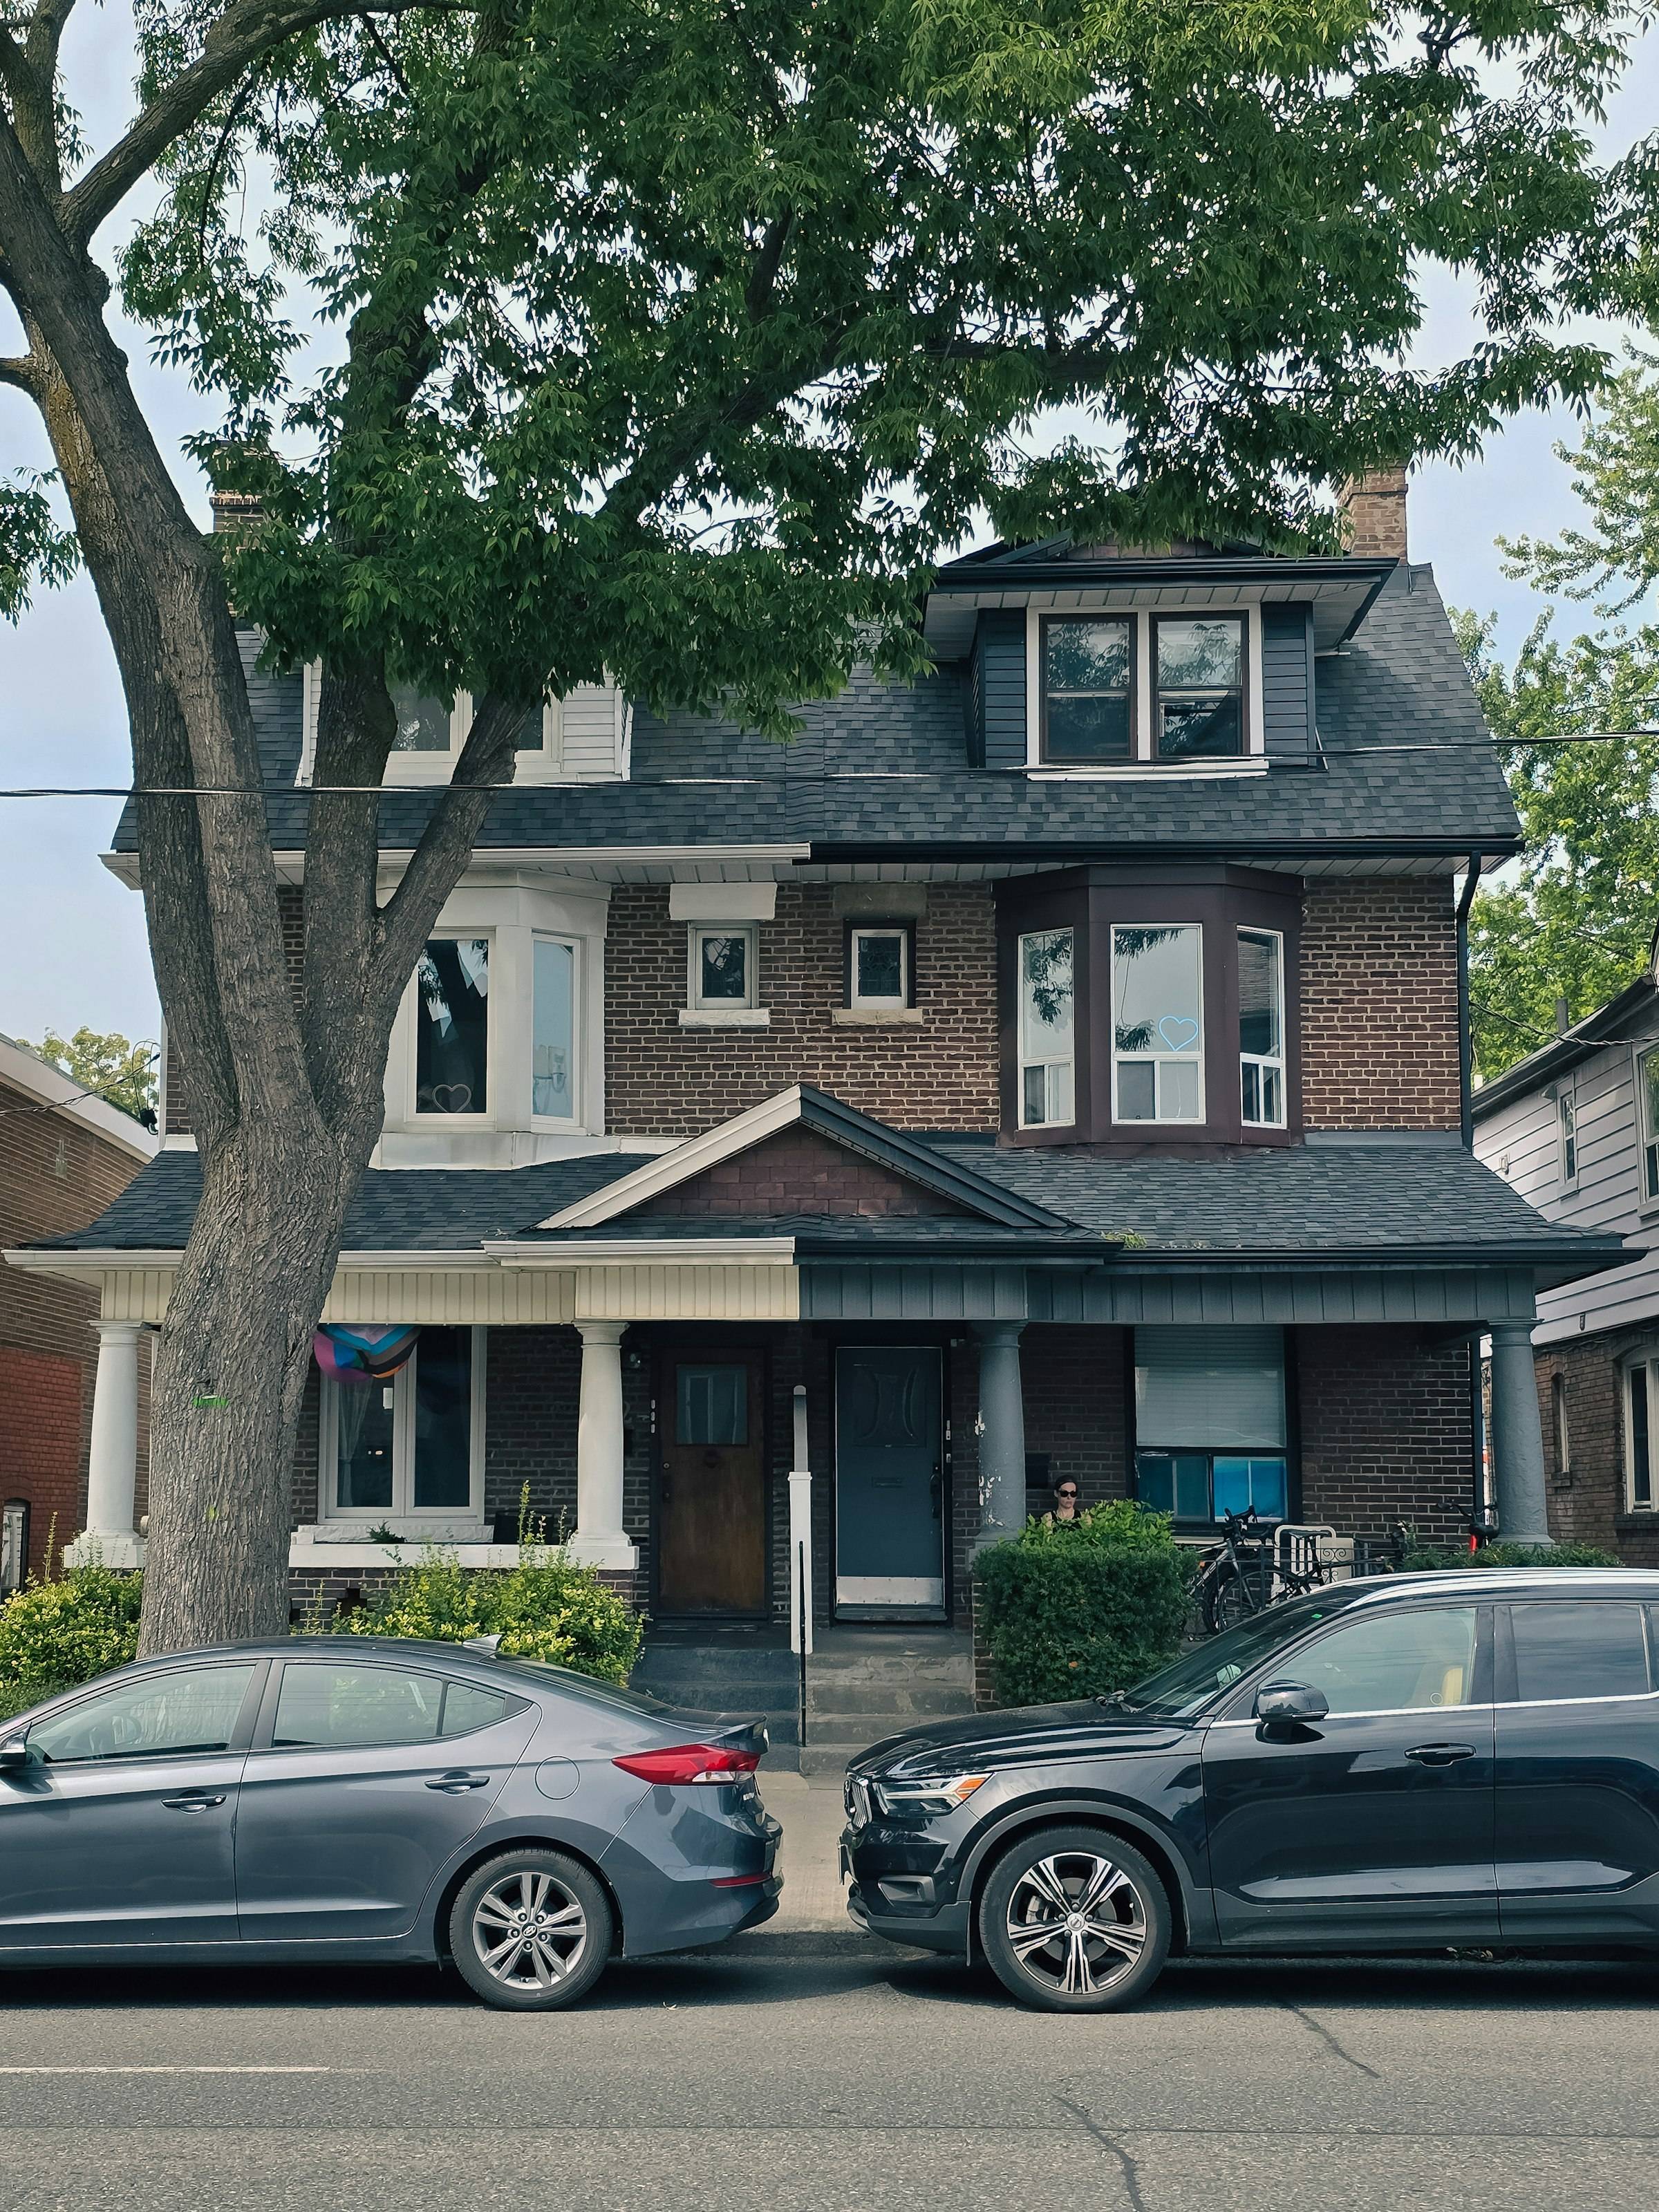
East York was a borough until 1998, the last one left in Ontario, and is now a district of Toronto.
Book a free Gameplan SessionSources: City of Toronto. Full citations at the foot of the page. Compiled November 2026.
TRREB sales for October 2026, and the 2021 Census housing mix.
What's your home worth?
Start with your address for a rough range on a East York home.
TRREB does not report East York as one area. The closest match is district E03, which covers East York's core along with Danforth and Playter Estates south of Danforth Avenue, and district C11, which covers Leaside and Thorncliffe Park along with Flemingdon Park in North York. In October 2026, E03 recorded 54 sales at an average of $1,105,607 and a median of $1,055,500, and most of them, 33, were detached houses averaging $1,169,912. C11 had 38 sales at an average of $1,498,487 and a median of $1,235,000, a mix of Leaside houses and Thorncliffe and Flemingdon apartments; its 14 condo apartment sales averaged $572,107. The composite benchmark was $1,020,500 in E03, down 4.63% year over year, and $1,155,800 in C11, up 0.21%.
East York splits into two very different housing types. Single-detached houses make up 32.4% of homes across the eight neighbourhoods and semis another 8.4%, and a large part of the borough's core was built for returning veterans after the Second World War. Detached houses reach 59.2% of homes in Old East York and 55.5% in Leaside-Bennington. At the same time, 41.0% of homes are in buildings of five or more storeys, rising to 93.4% in Thorncliffe Park and 75.8% in Taylor-Massey, which includes Crescent Town. Renters slightly outnumber owners overall, with 48.0% of households owning, but the split runs from 72.4% owners in Leaside-Bennington to 14.0% in Thorncliffe Park. The income gap between neighbourhoods is wide. Leaside-Bennington has a median household income of $148,000, while Thorncliffe Park's is $67,000 and Taylor-Massey's and Broadview North's are both $68,500.
Stations, rapid transit and highways.
Boundaries change. Confirm your address with the board before you buy.
Parks, neighbourhoods and who East York suits.
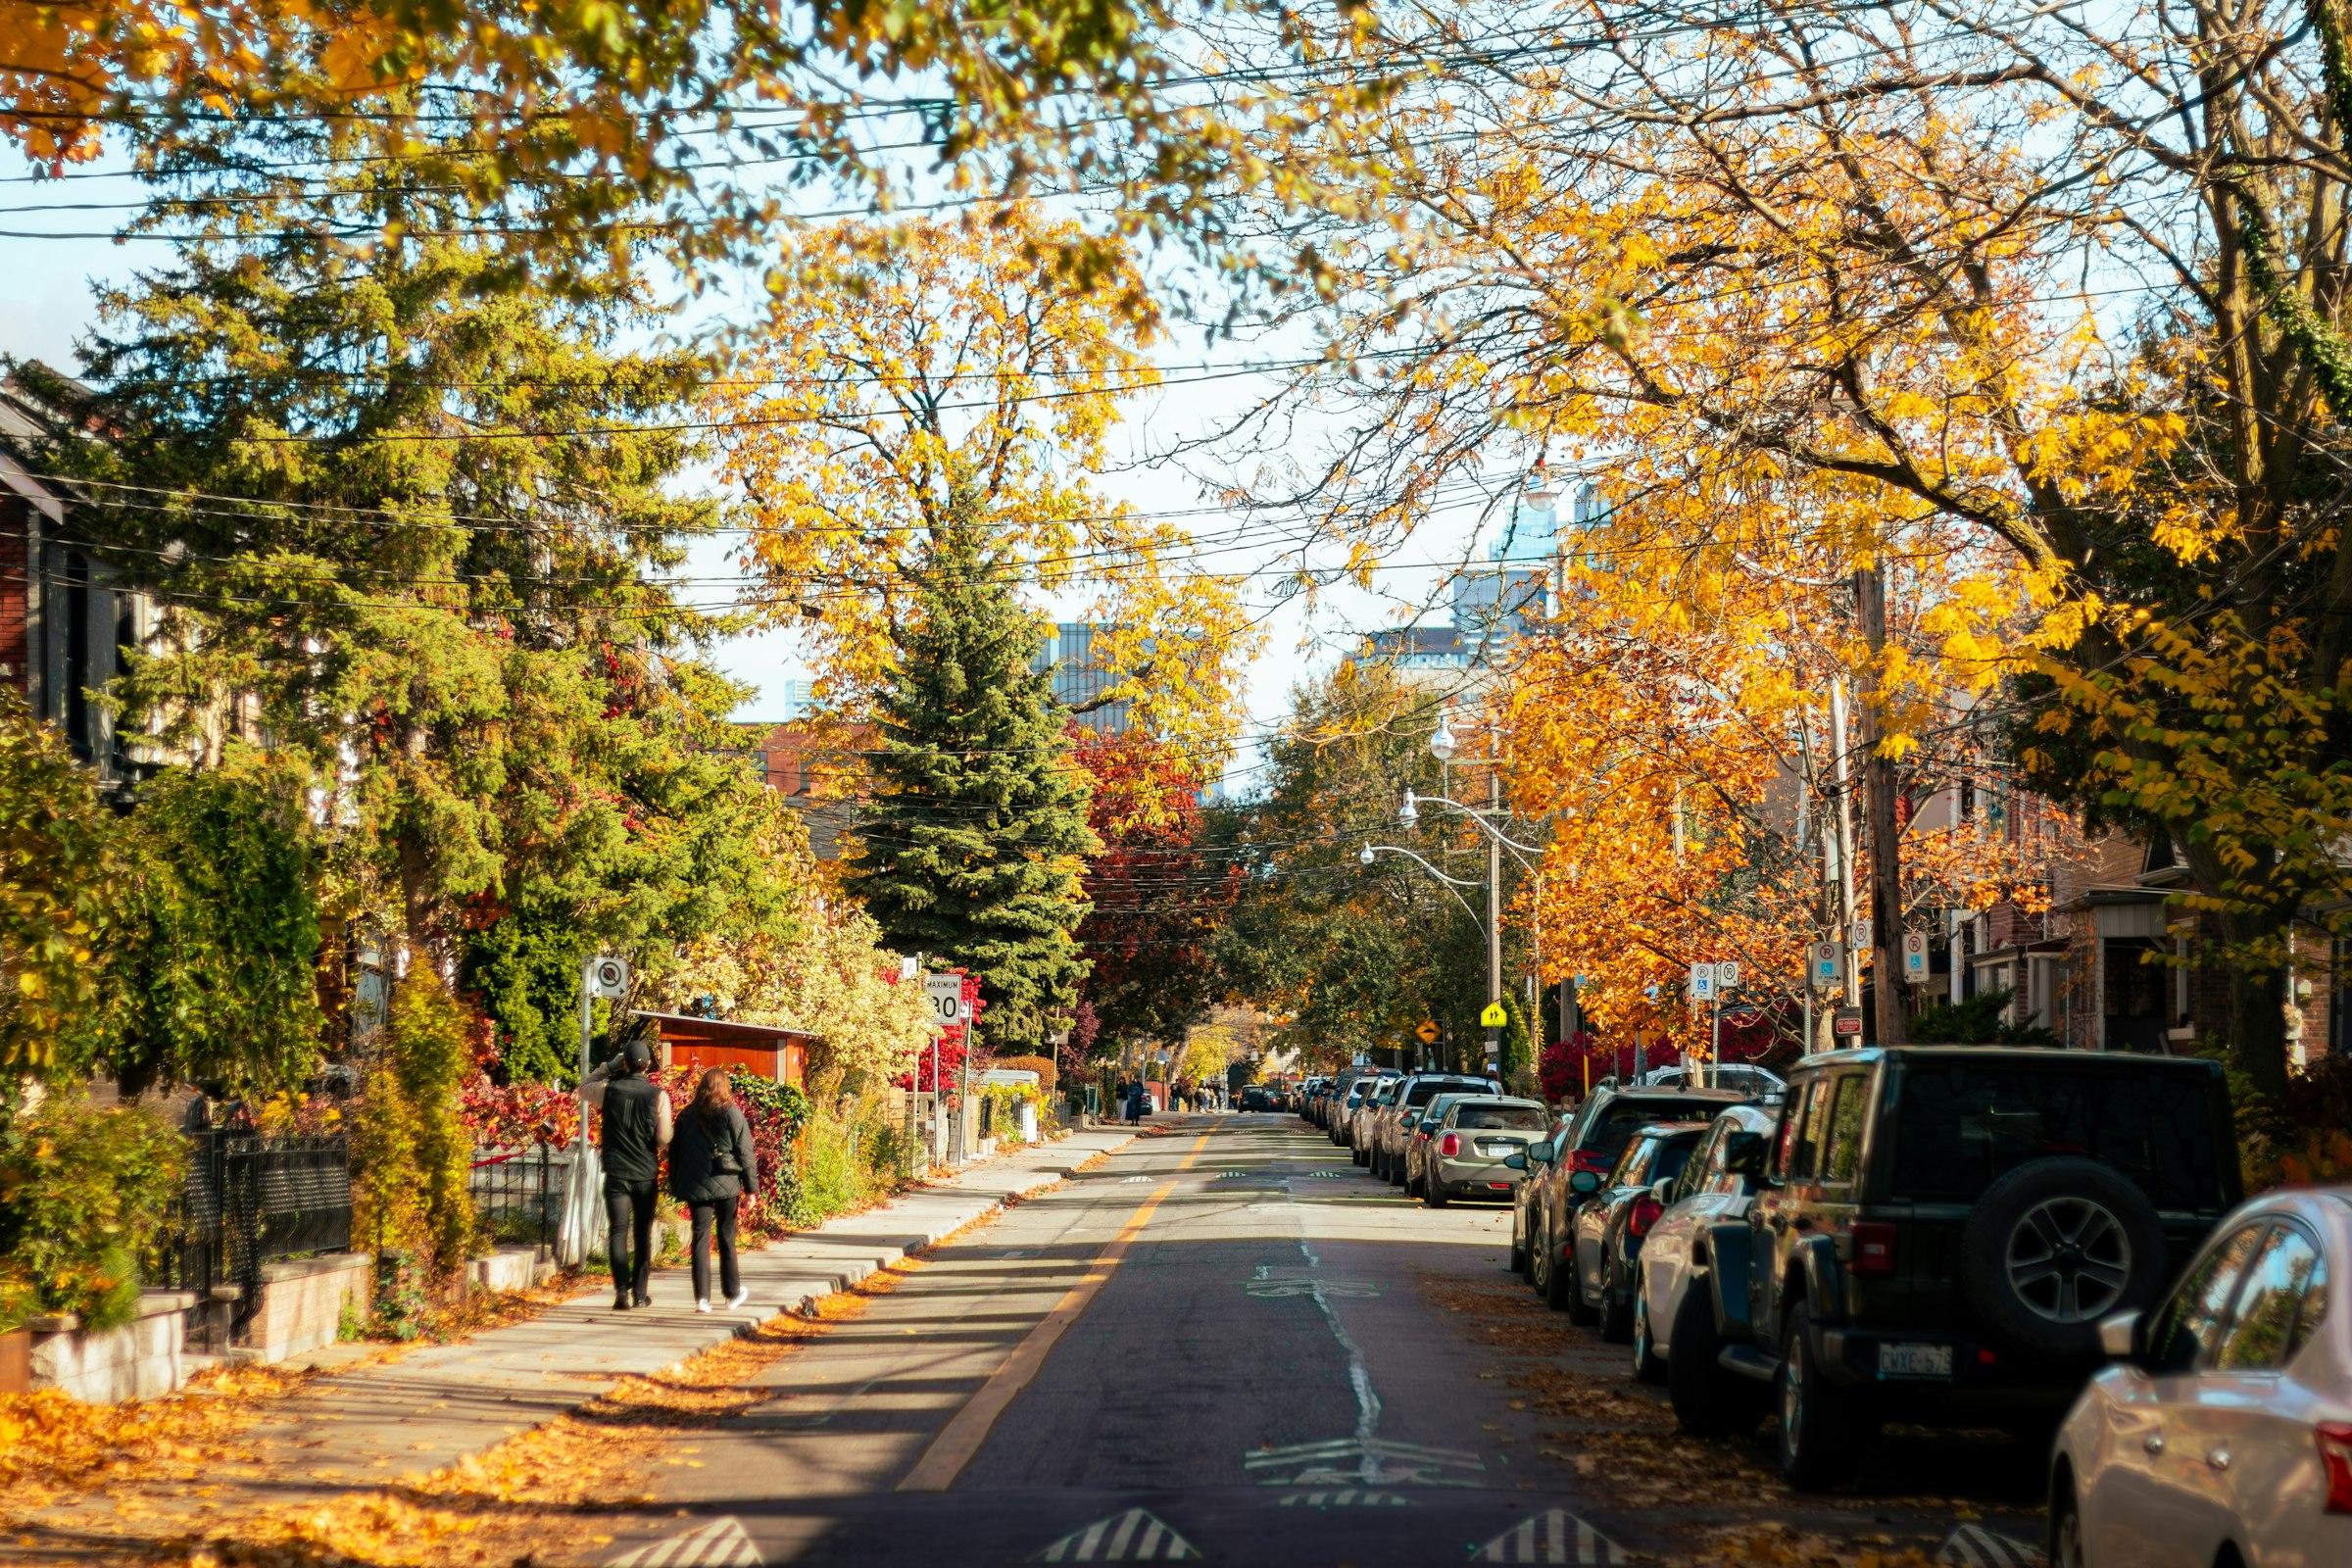
East York was a borough until 1998, the last one left in Ontario, and is now a district of Toronto. Its traditional core sits north of Danforth Avenue between the Don River and Victoria Park Avenue, and it also takes in Leaside, Bennington Heights and Thorncliffe Park on the other side of the river. Much of the core was built for returning Second World War veterans and early baby boom families.
East York is defined by its ravines. The Don River separates the old borough from the former City of Toronto, Taylor Creek Park is reached from Dawes Road, and E.T. Seton Park, entered from Thorncliffe Park Drive, has disc golf and picnic areas. Neighbourhood parks such as Stan Wadlow and Trace Manes double as community hubs, with sports fields, a skate area and a community centre. Each part of the district has its own character: Leaside-Bennington is mostly detached houses with a median household income of $148,000 and a median age of 44.4, while Thorncliffe Park is almost entirely high-rise with a median age of 34.0. Across the eight neighbourhoods, 40.9% of residents are immigrants.
Get a custom list of homes in East York that match your budget and must-haves, sent to you as they come up.
Still unsure? Call or text 437-525-2544.
Yes. East York was a borough within Metropolitan Toronto from 1967 until 1998, when it was amalgamated into the current City of Toronto. It was the last borough in Ontario.
The traditional core is north of Danforth Avenue between the Don River and Victoria Park Avenue, including Old East York, Danforth Village, Broadview North, O'Connor-Parkview, Woodbine-Lumsden and Crescent Town. Leaside, Bennington Heights and Thorncliffe Park, west of the river, joined East York in 1967.
In October 2026, TRREB district E03 averaged $1,105,607 across 54 sales, with detached houses averaging $1,169,912. District C11, which includes Leaside and Thorncliffe Park, averaged $1,498,487 across 38 sales.
It is close to even, with slightly more renters. Across the eight East York neighbourhoods, 48.0% of households owned their home in 2021, ranging from 72.4% in Leaside-Bennington and 69.1% in Danforth-East York to 14.0% in Thorncliffe Park.
Photos are stock or Creative Commons images for illustration, not homes listed or sold by Ishwar Garg. Photo credits.
Market figures are averages for the period shown and vary by property type and street. They are not an appraisal of any home. Try the home value calculator for a rough range on a specific property.
Land transfer tax, closing costs and first-time buyer incentives, with official sources.
Buying
Ontario and Toronto land transfer tax rates, first-time buyer refunds, and worked examples at $700K, $1M and $1.3M, with every step of the math shown.
Updated 6 min read
Buying
Every closing cost a GTA buyer pays, from land transfer tax and PST on default insurance to title insurance and adjustments, with official sources.
Updated 6 min read
Buying
FHSA, the RRSP Home Buyers' Plan, land transfer tax refunds, GST/HST rebates and down payment rules for GTA first-time buyers, with official sources.
Updated 9 min read
One free session to check budget, commute and the homes worth seeing.
Or call 437-525-2544