Neighbourhoods
18 GTA area guides. Prices, homes, schools and transit, every figure sourced.
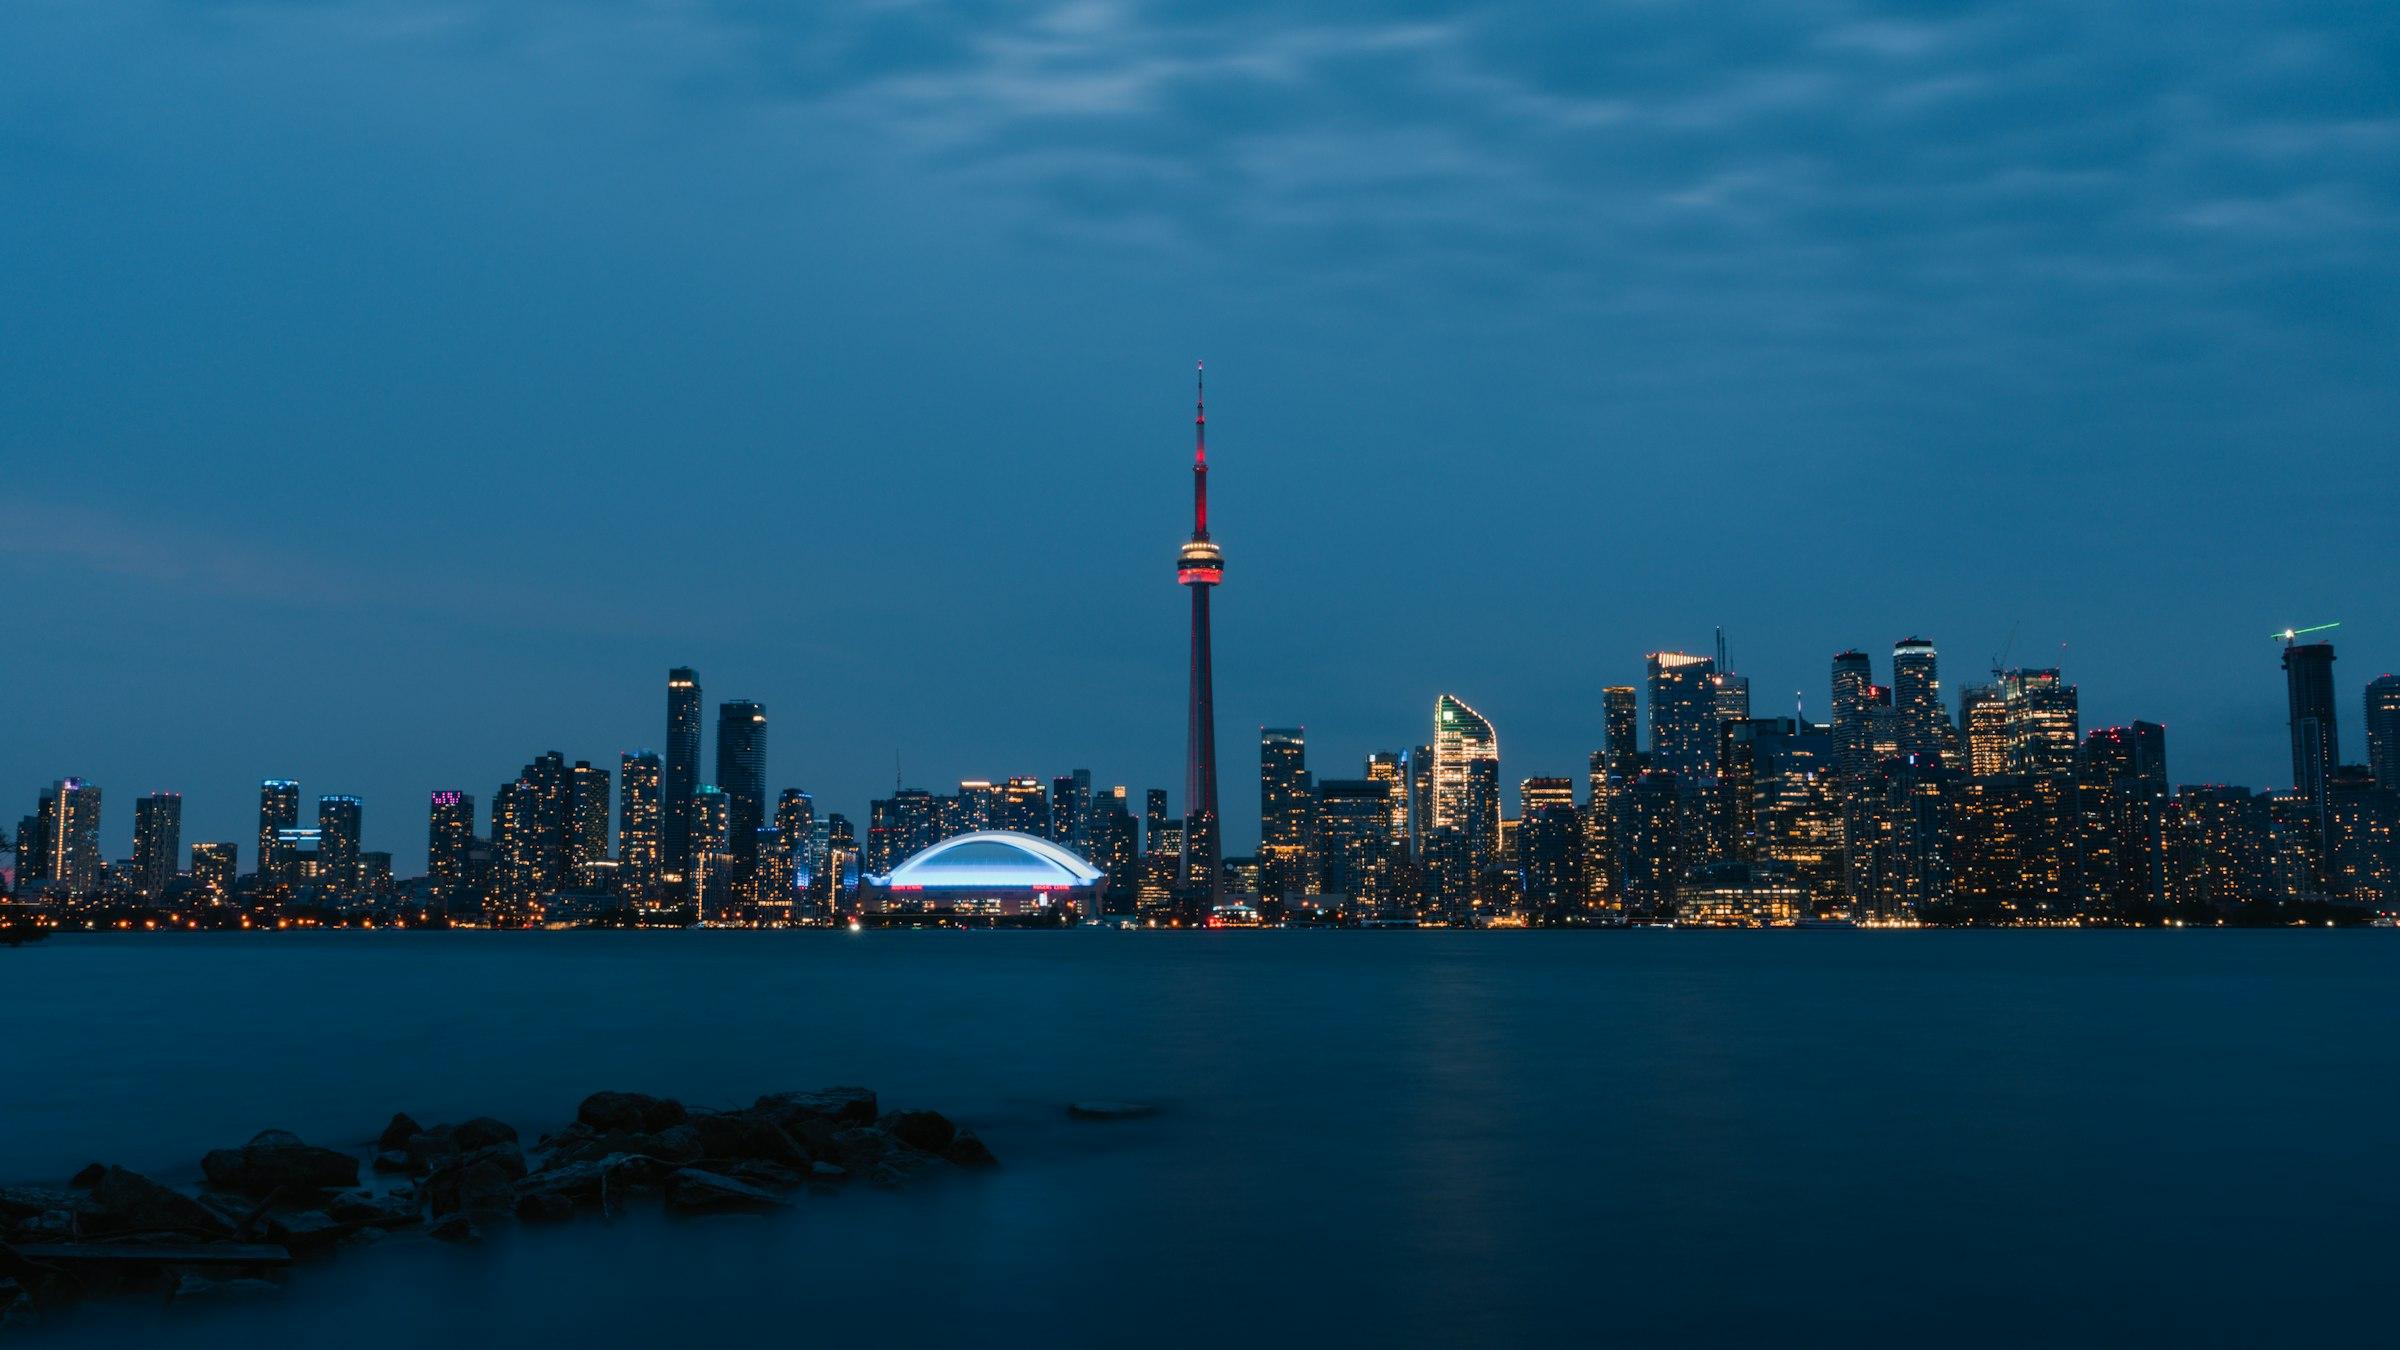
Toronto
$1,075,627TRREB avg, Oct 2026
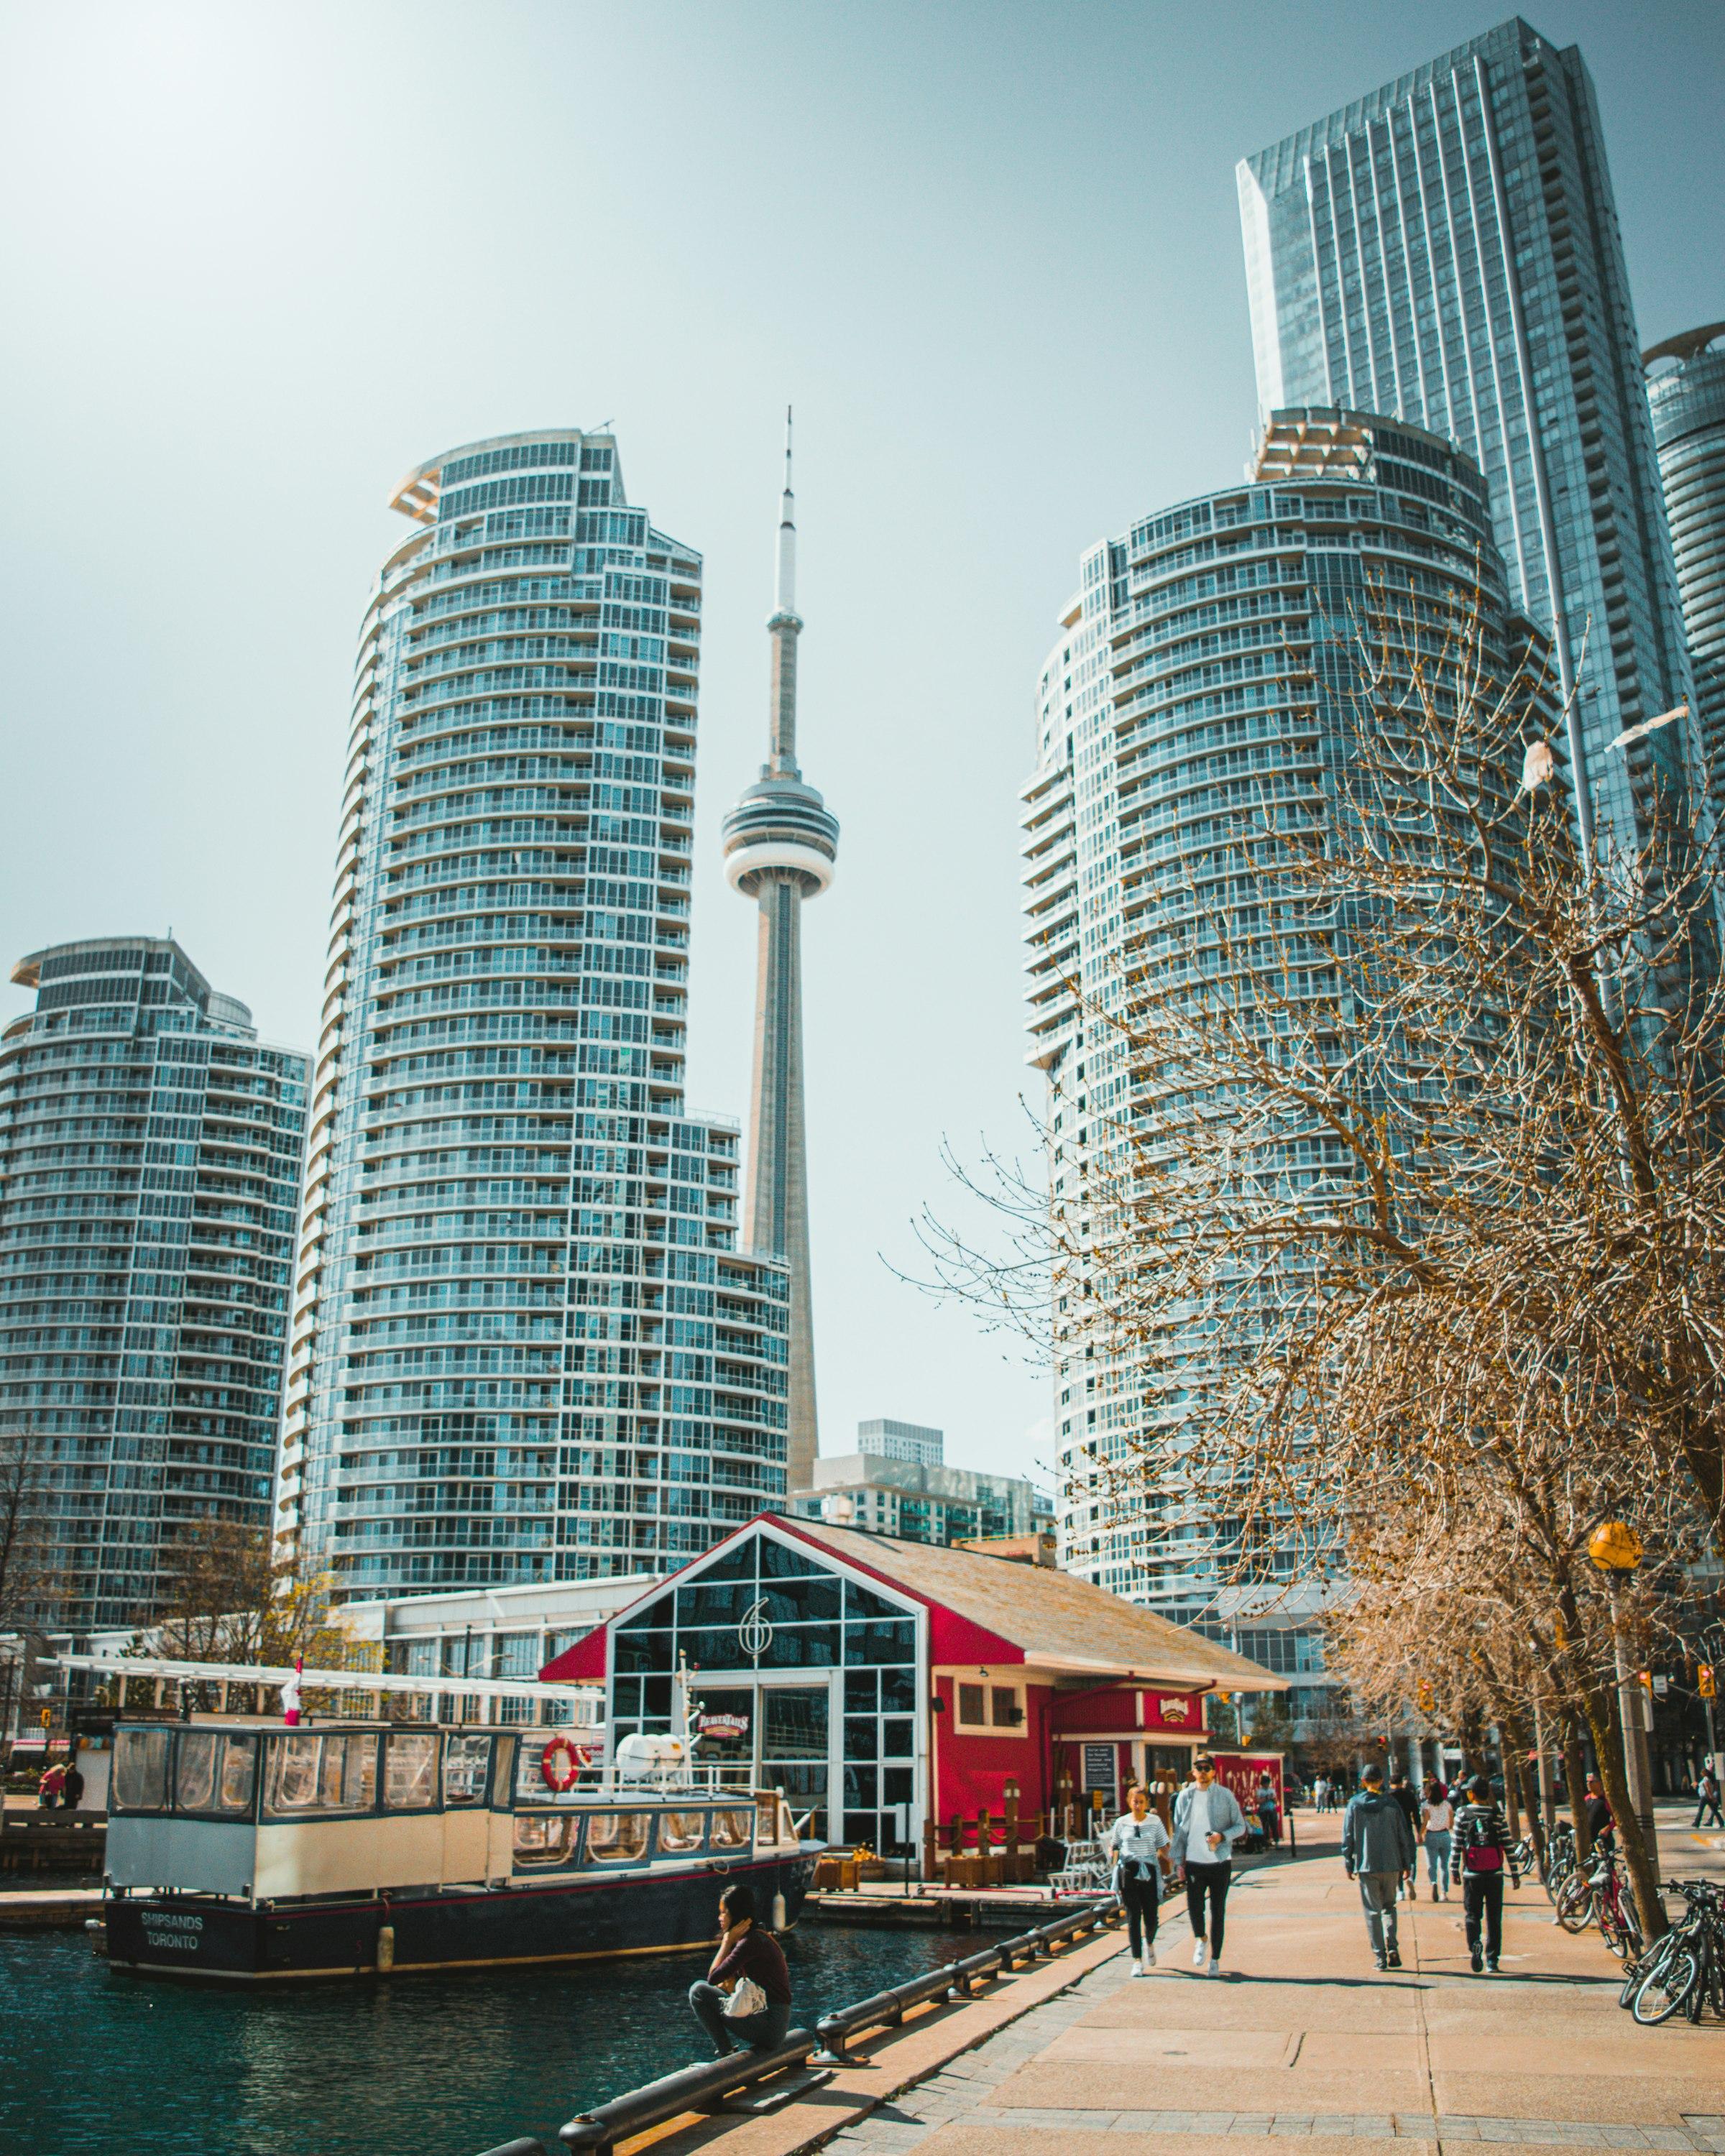
Downtown Toronto
2021 Census profile
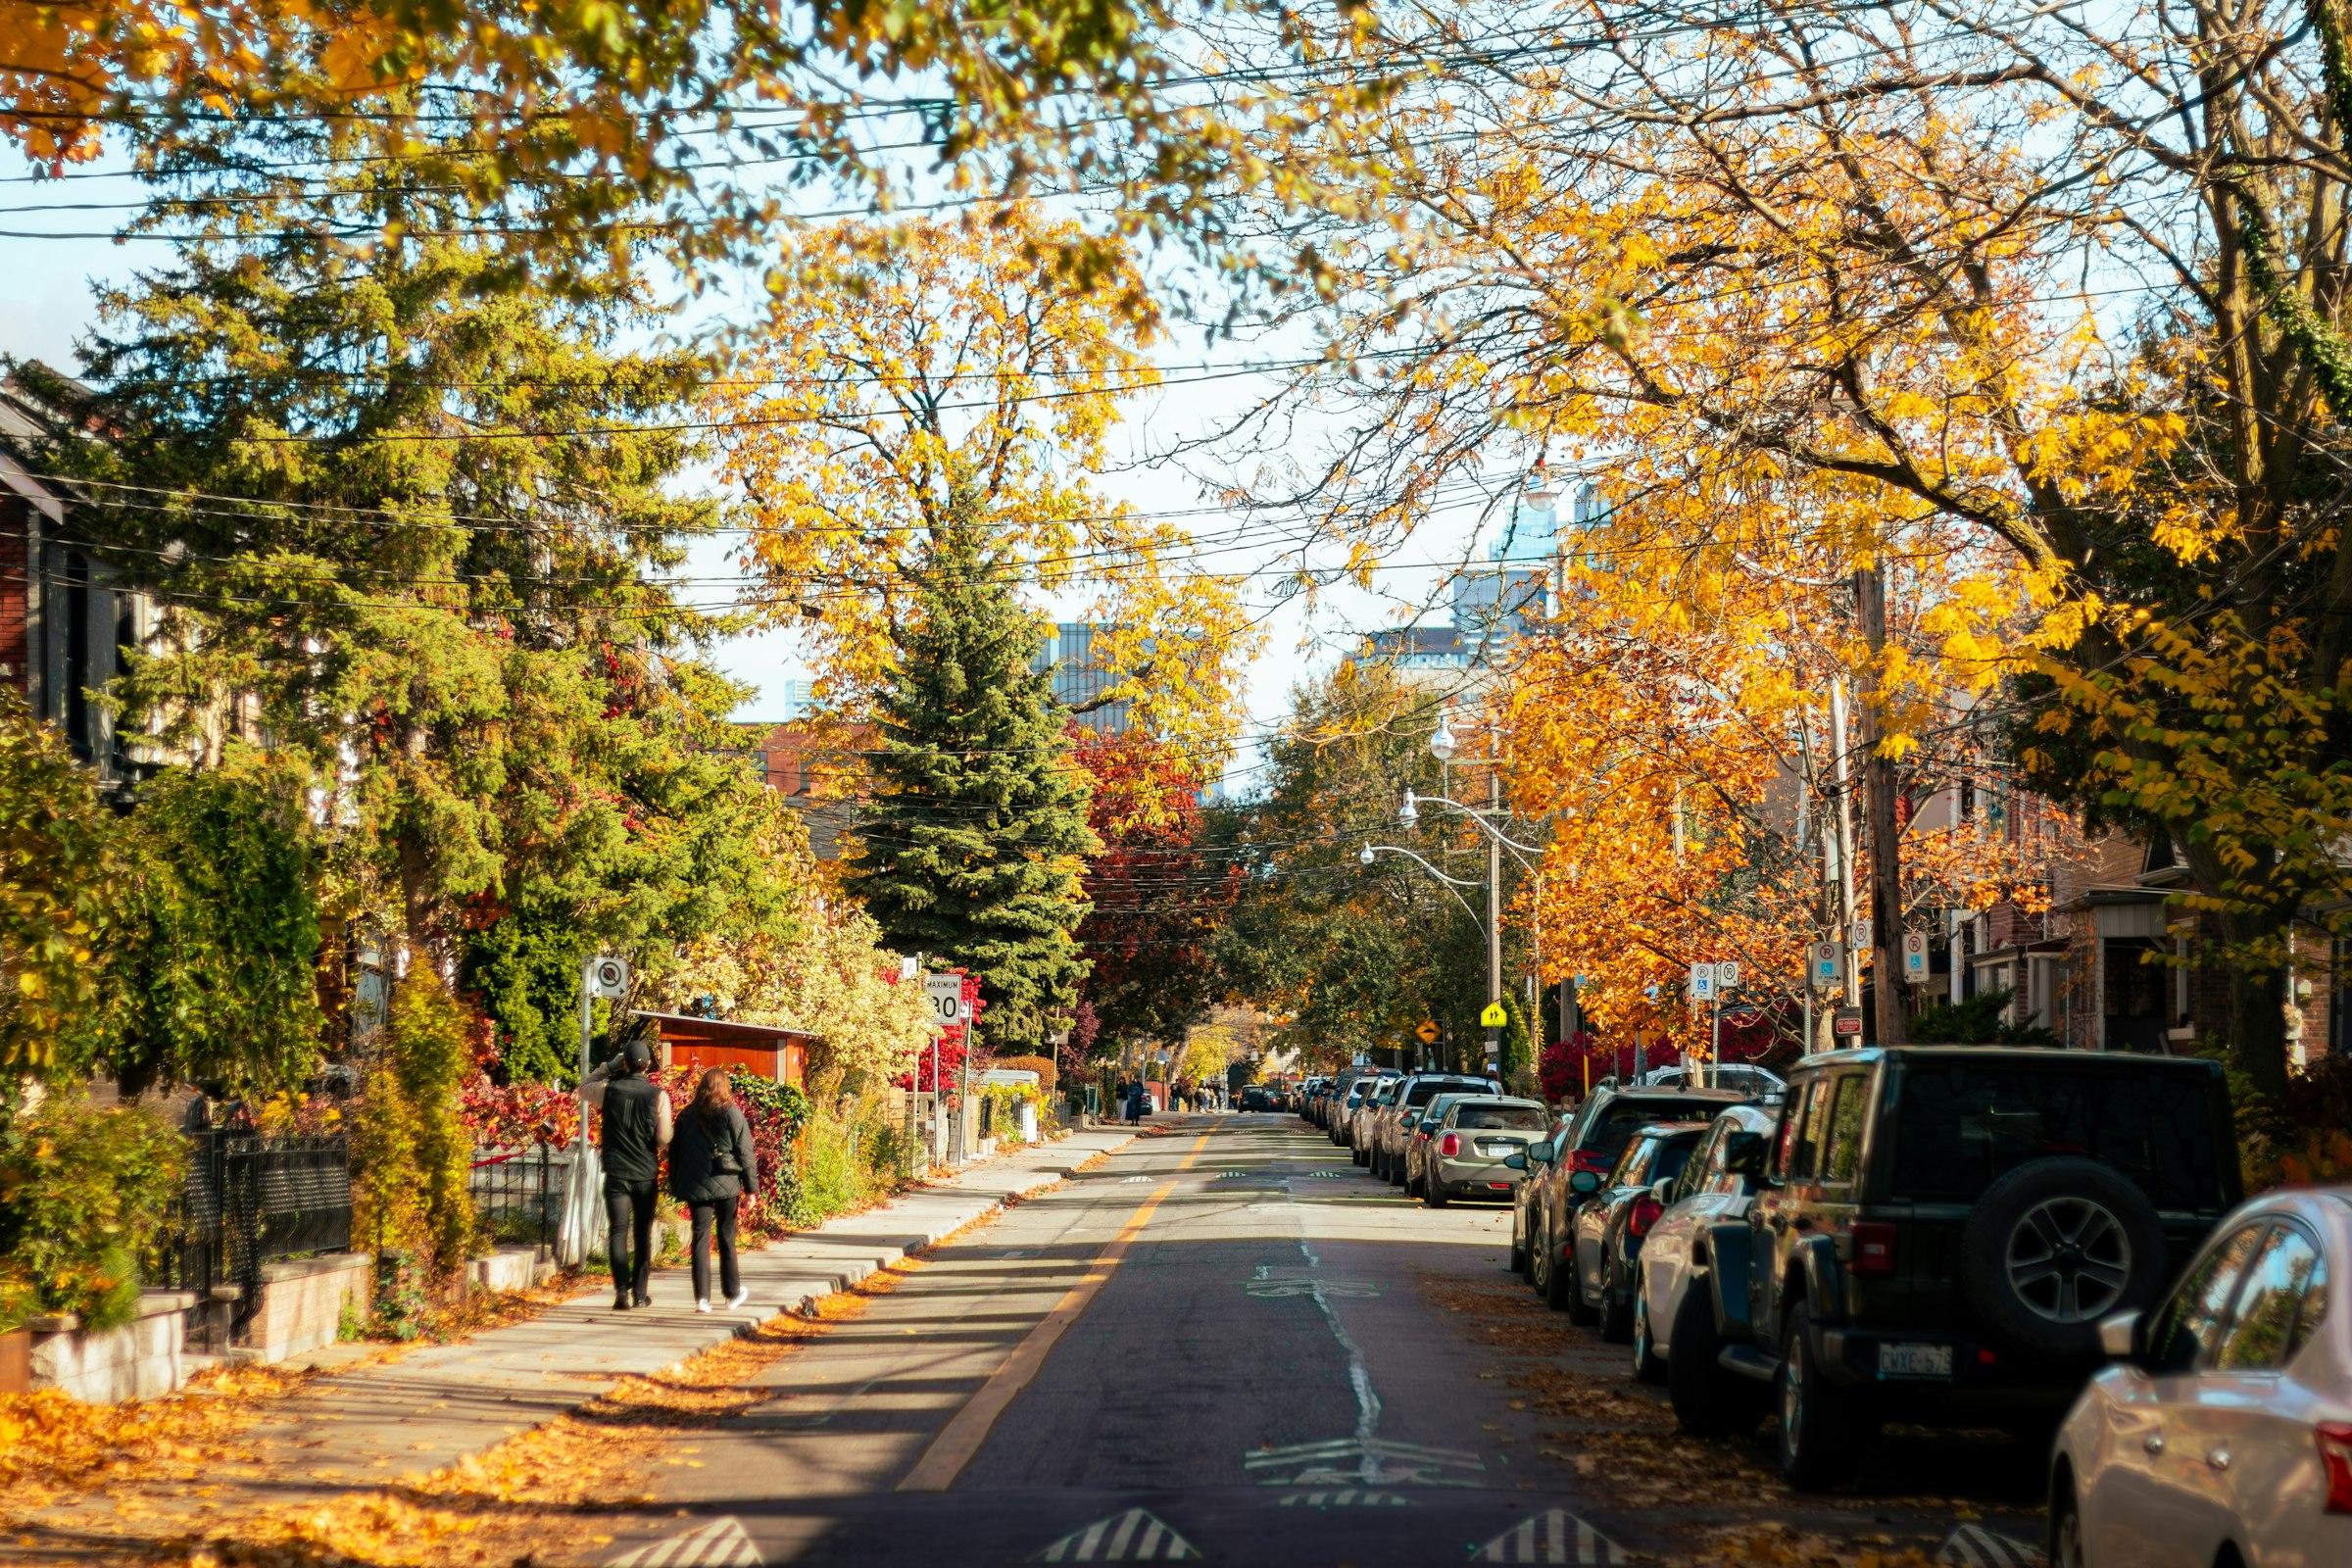
North York
$1,016,520TRREB avg, Oct 2026
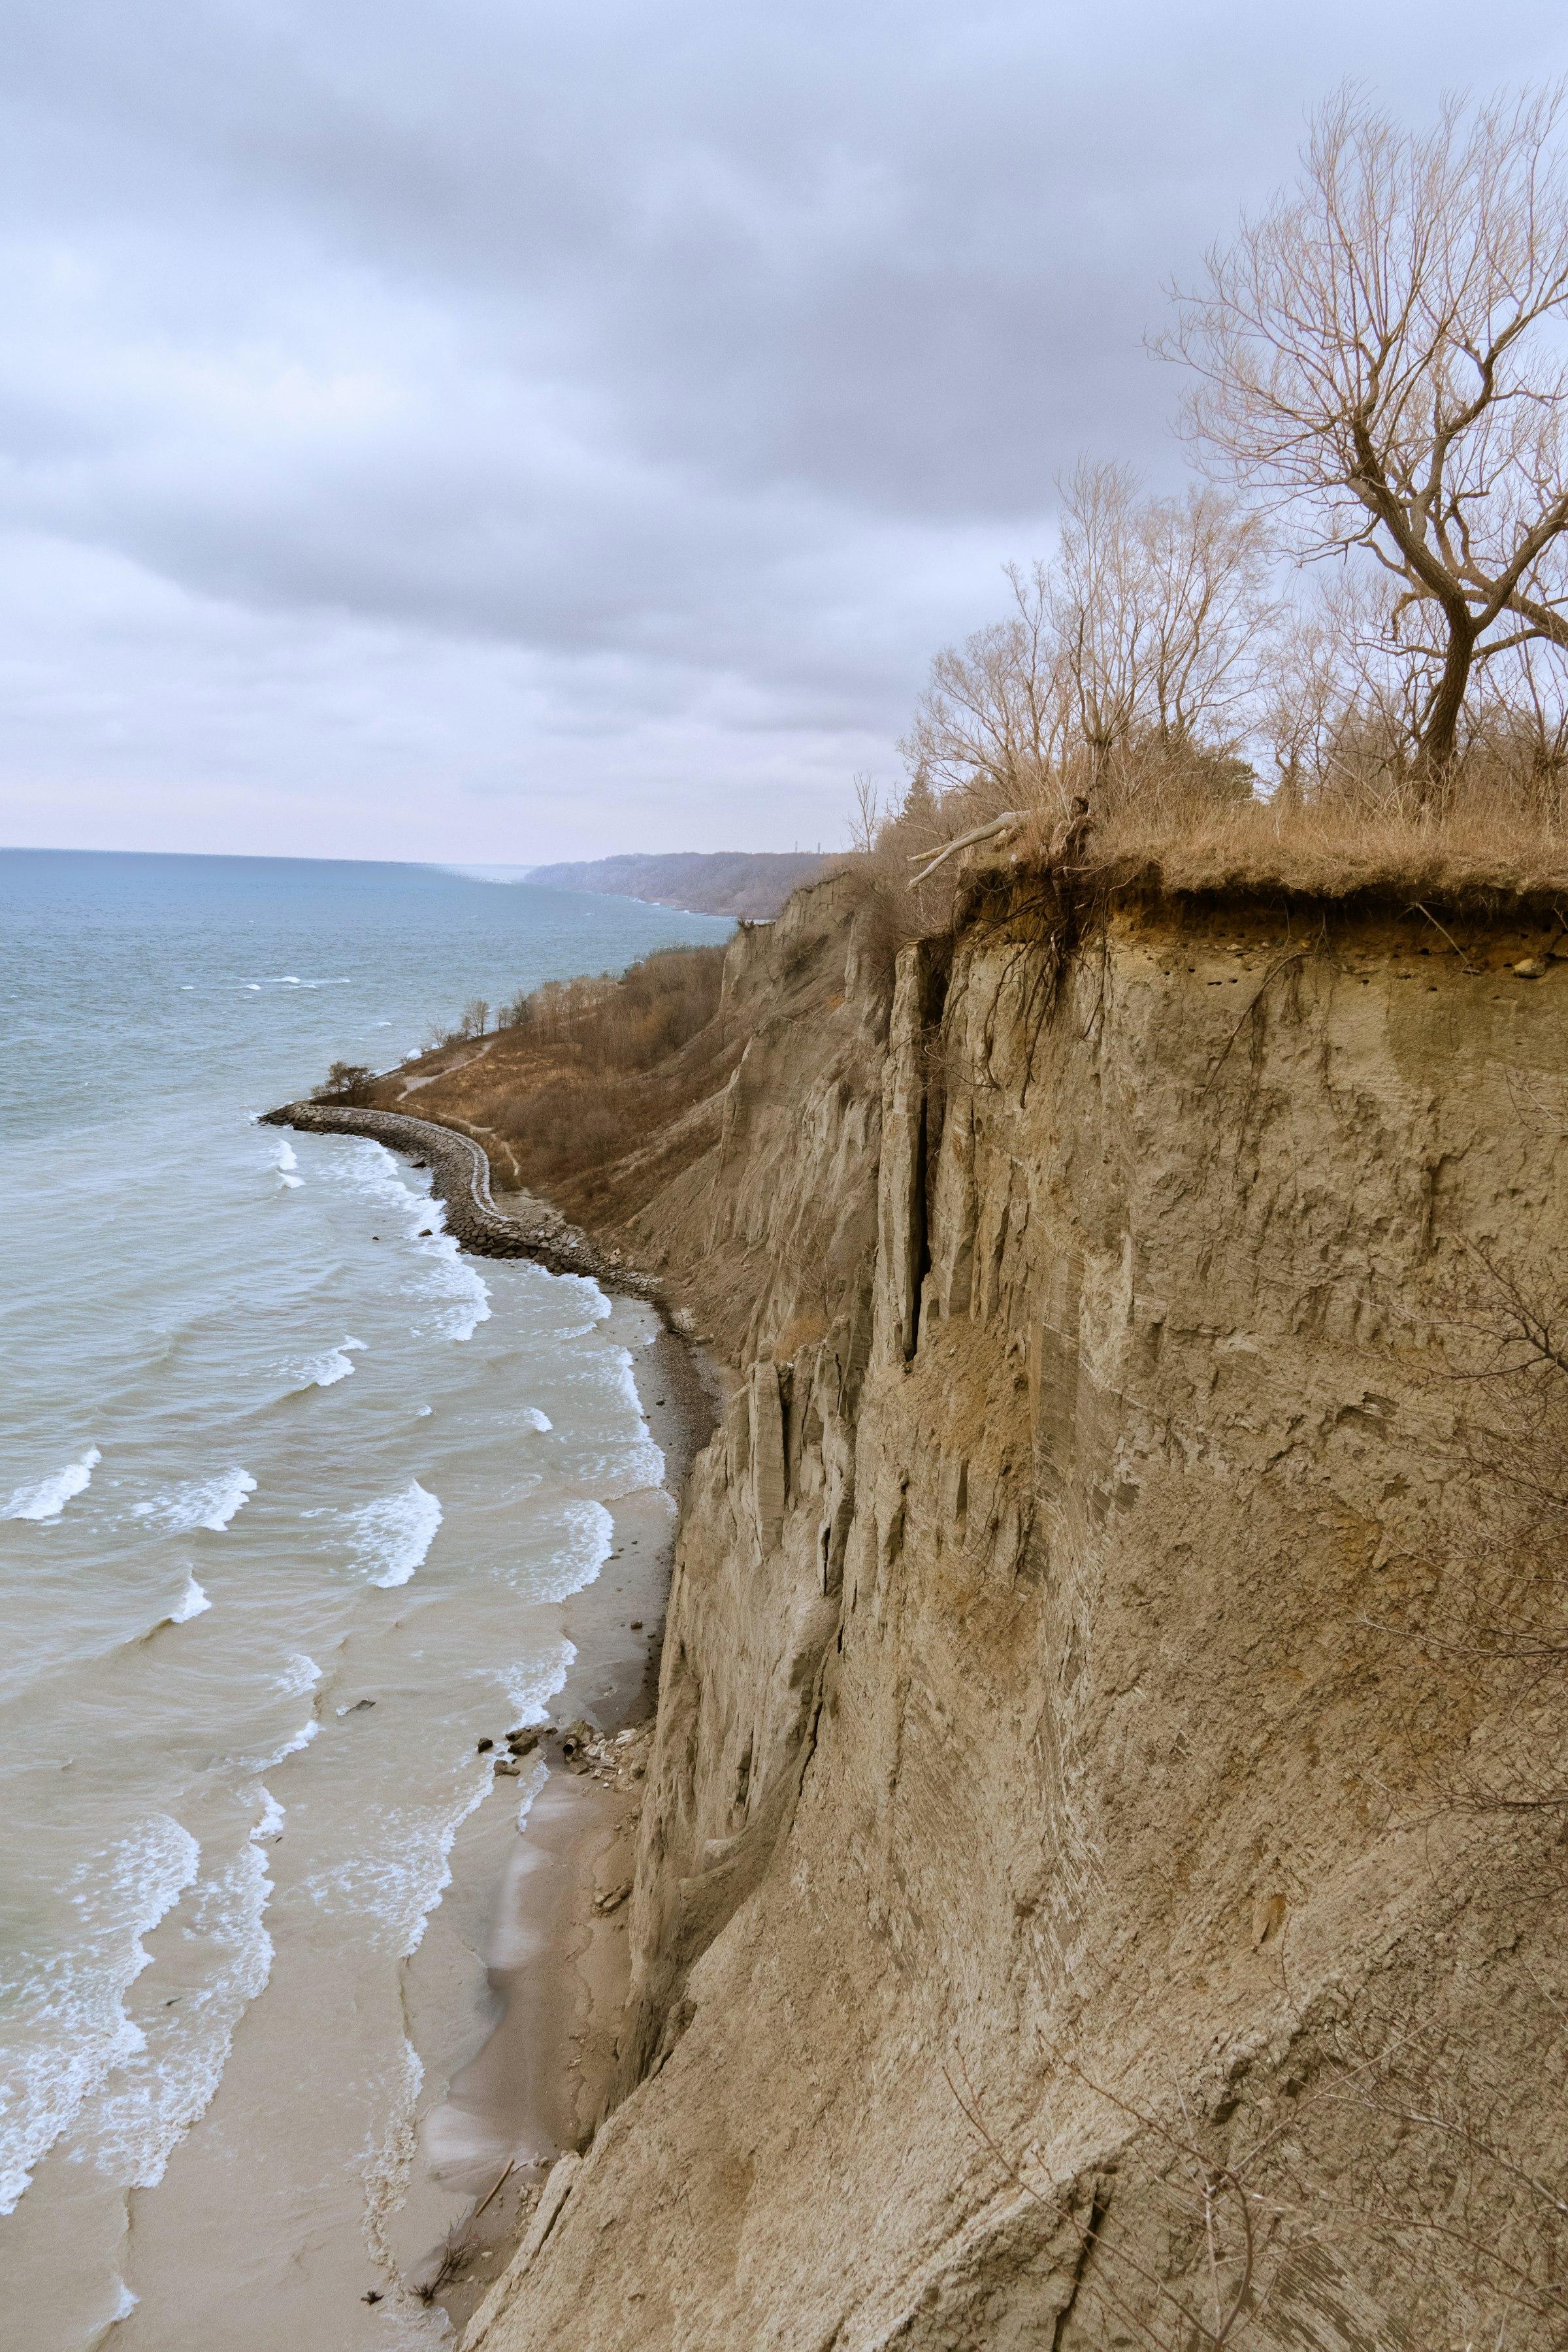
Scarborough
$814,444TRREB avg, Oct 2026
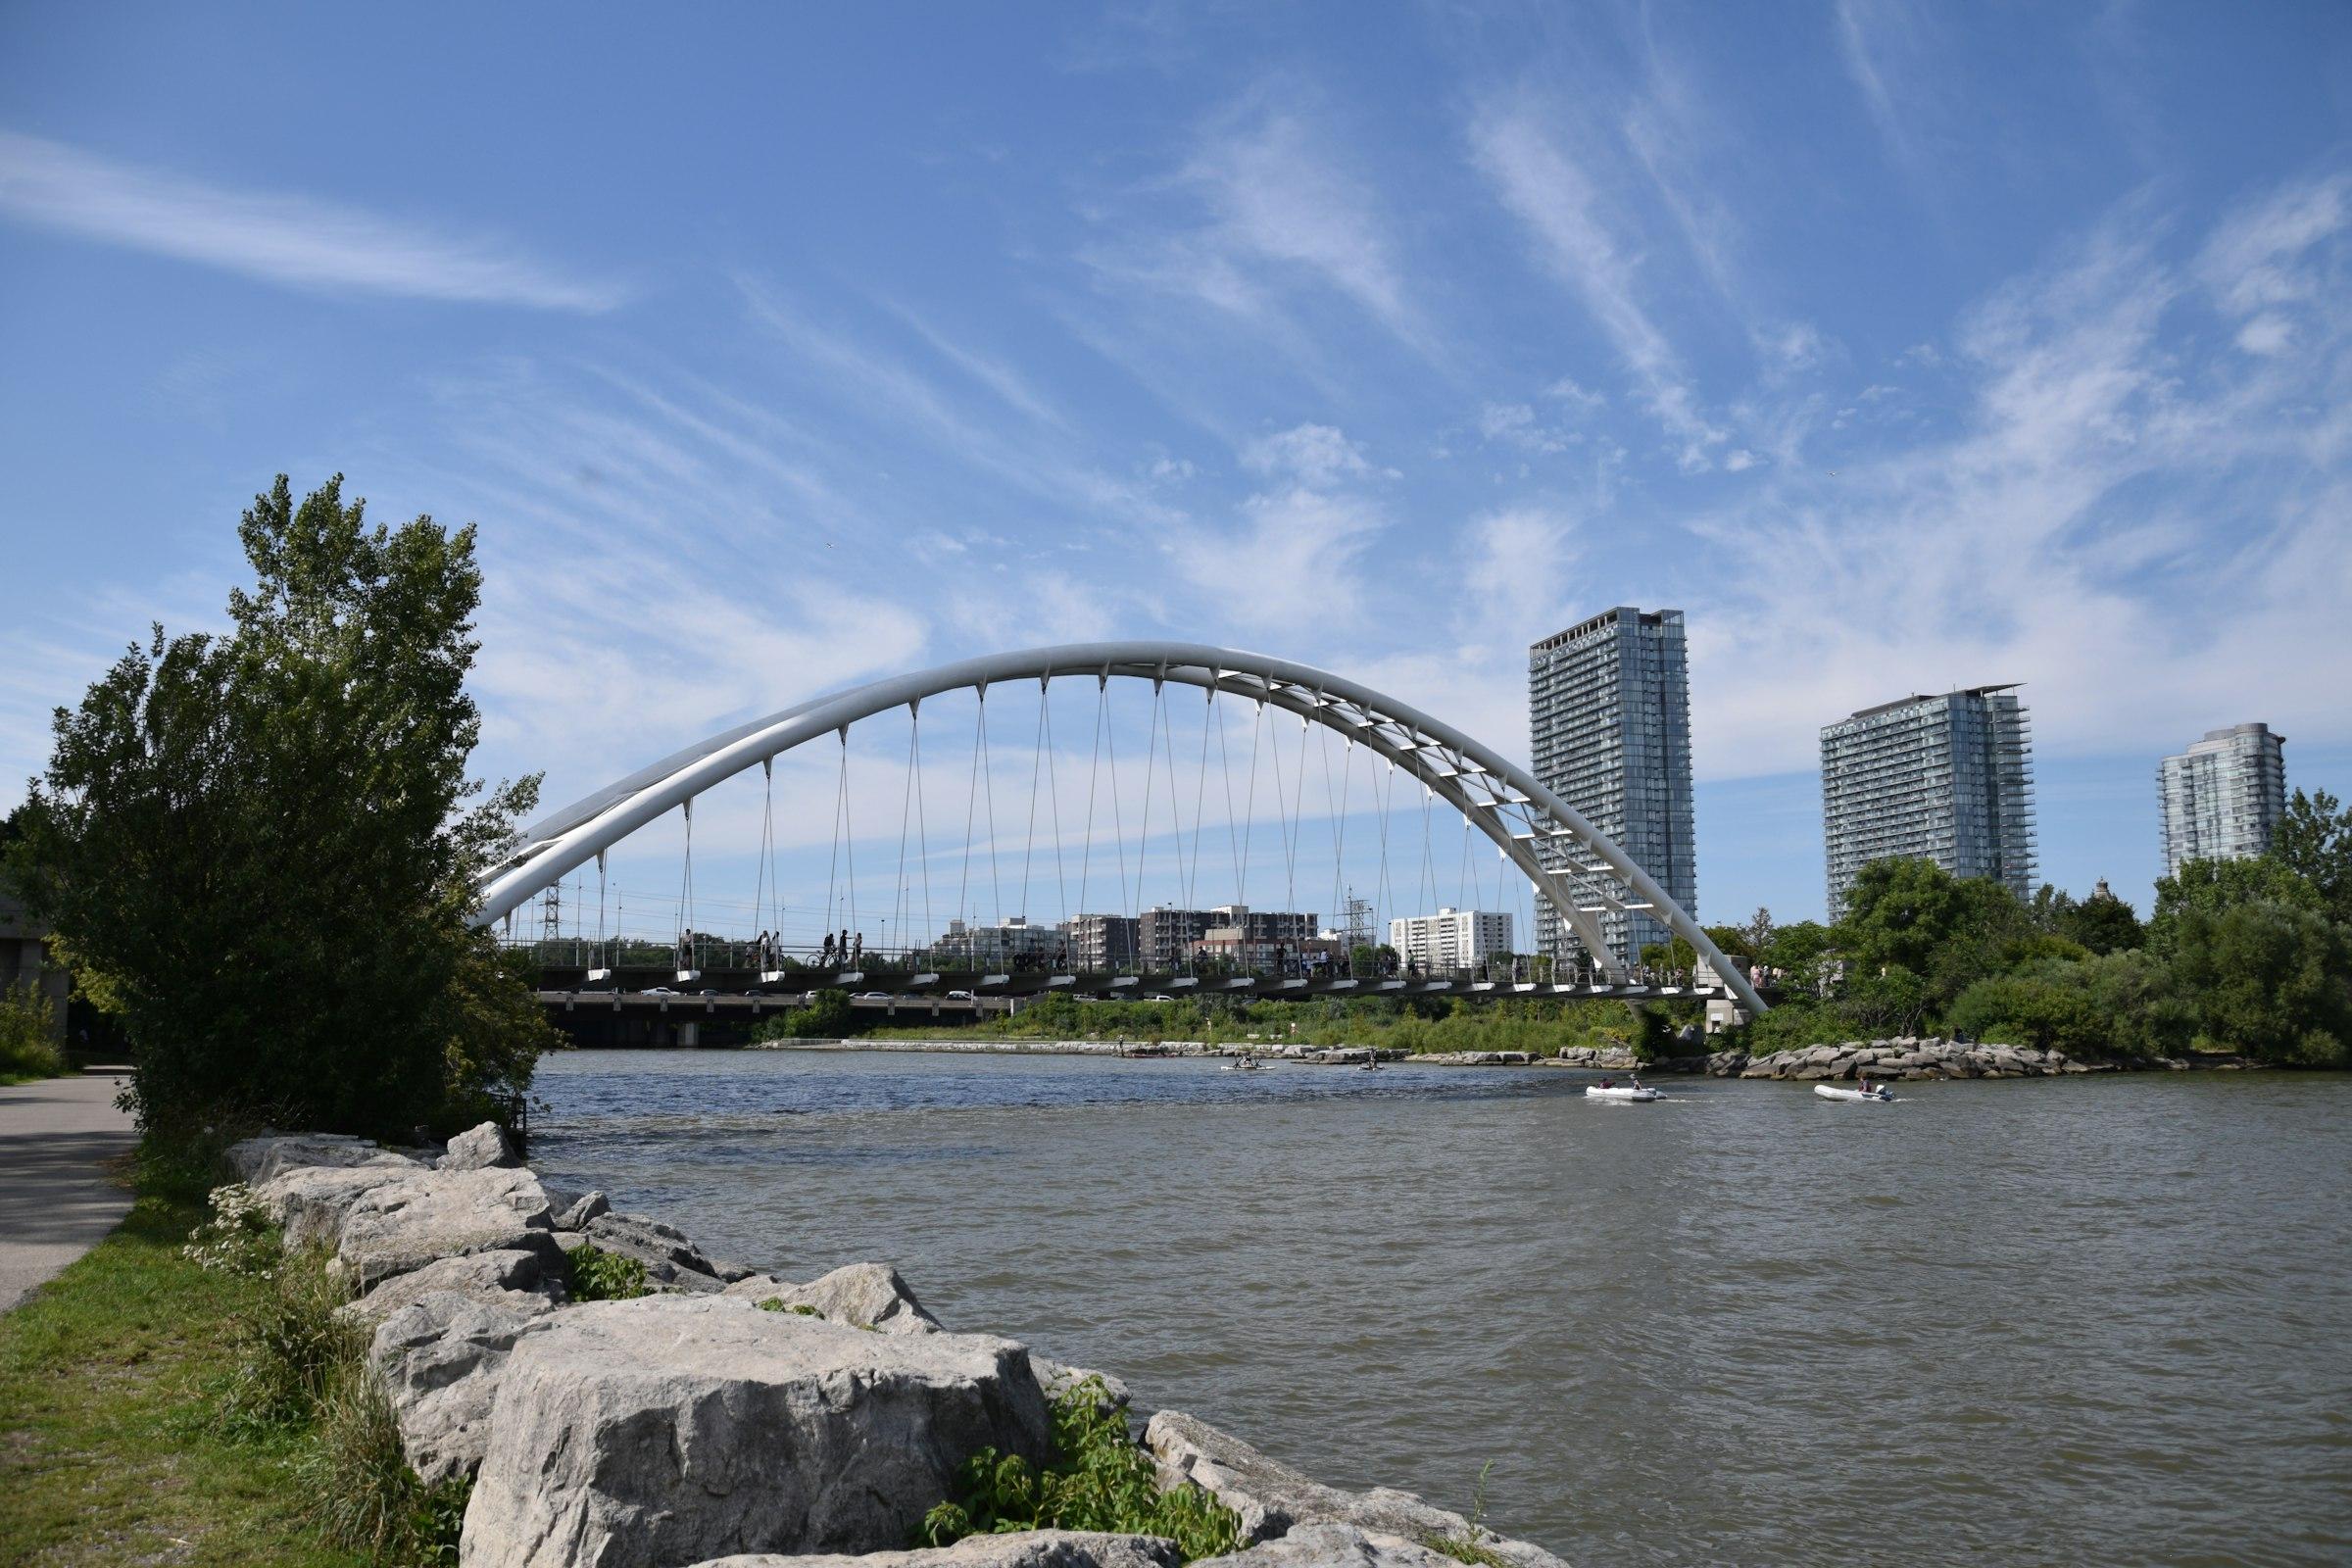
Etobicoke
$965,845TRREB avg, Oct 2026
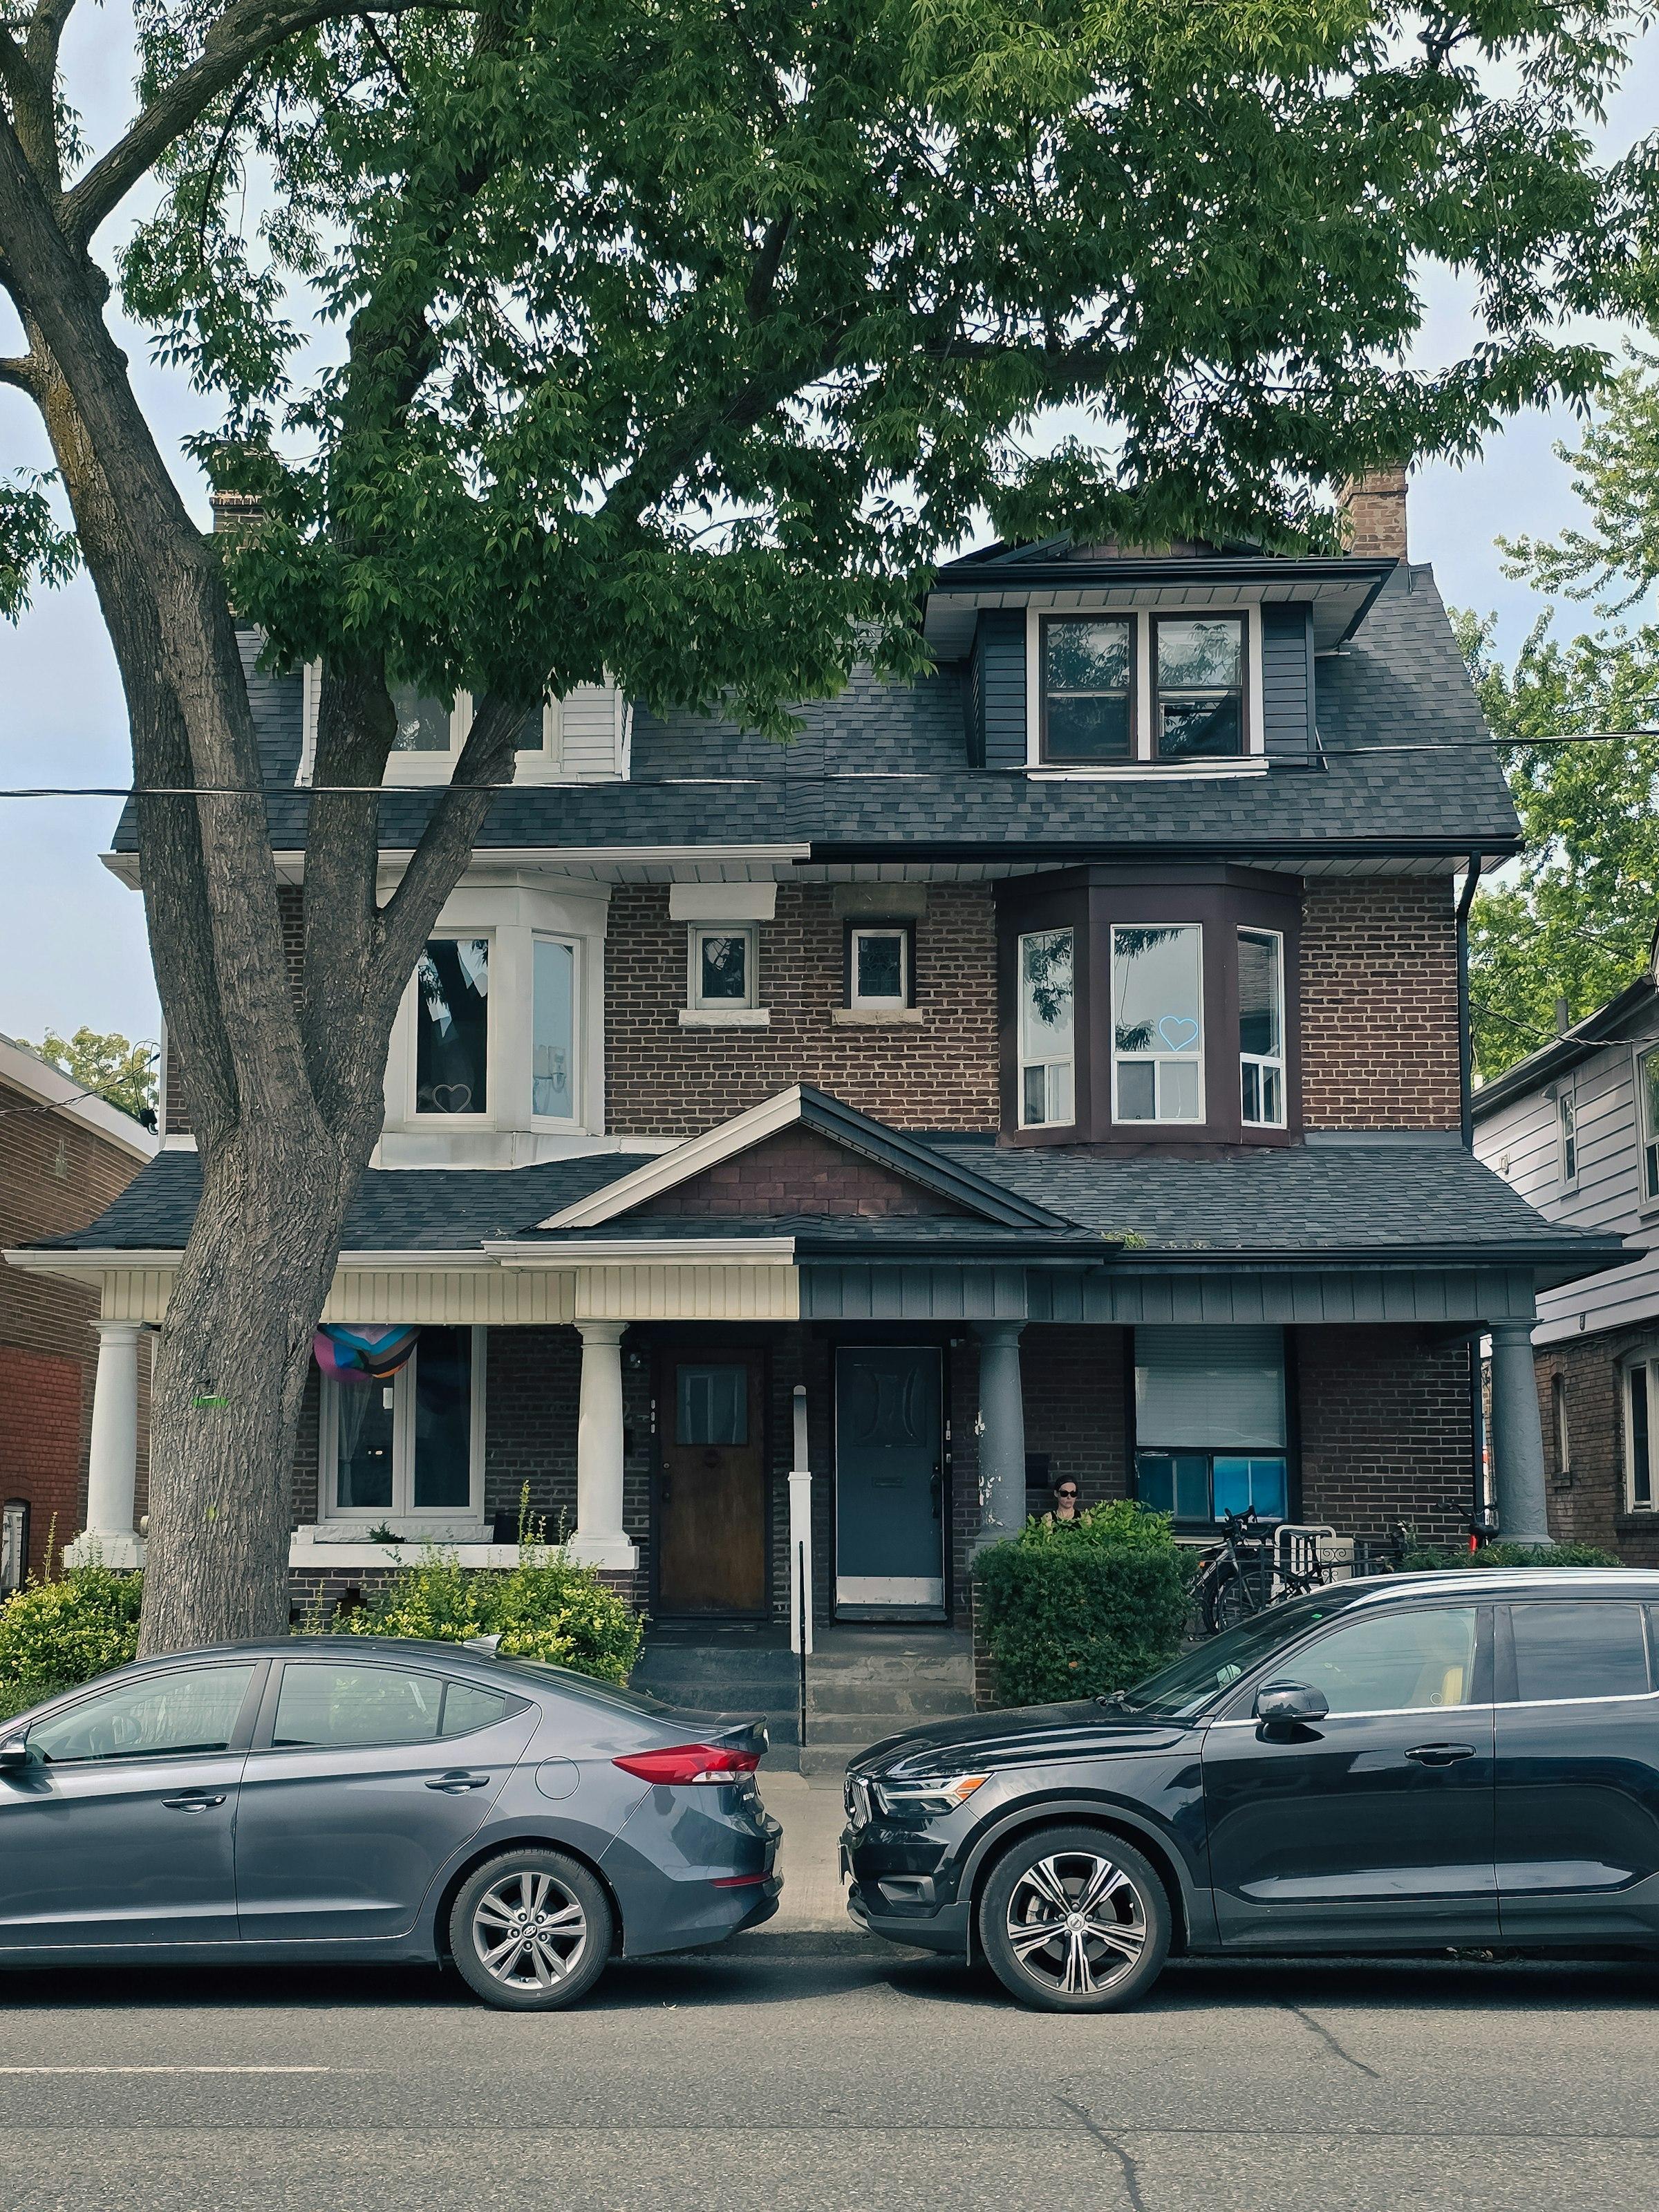
East York
2021 Census profile
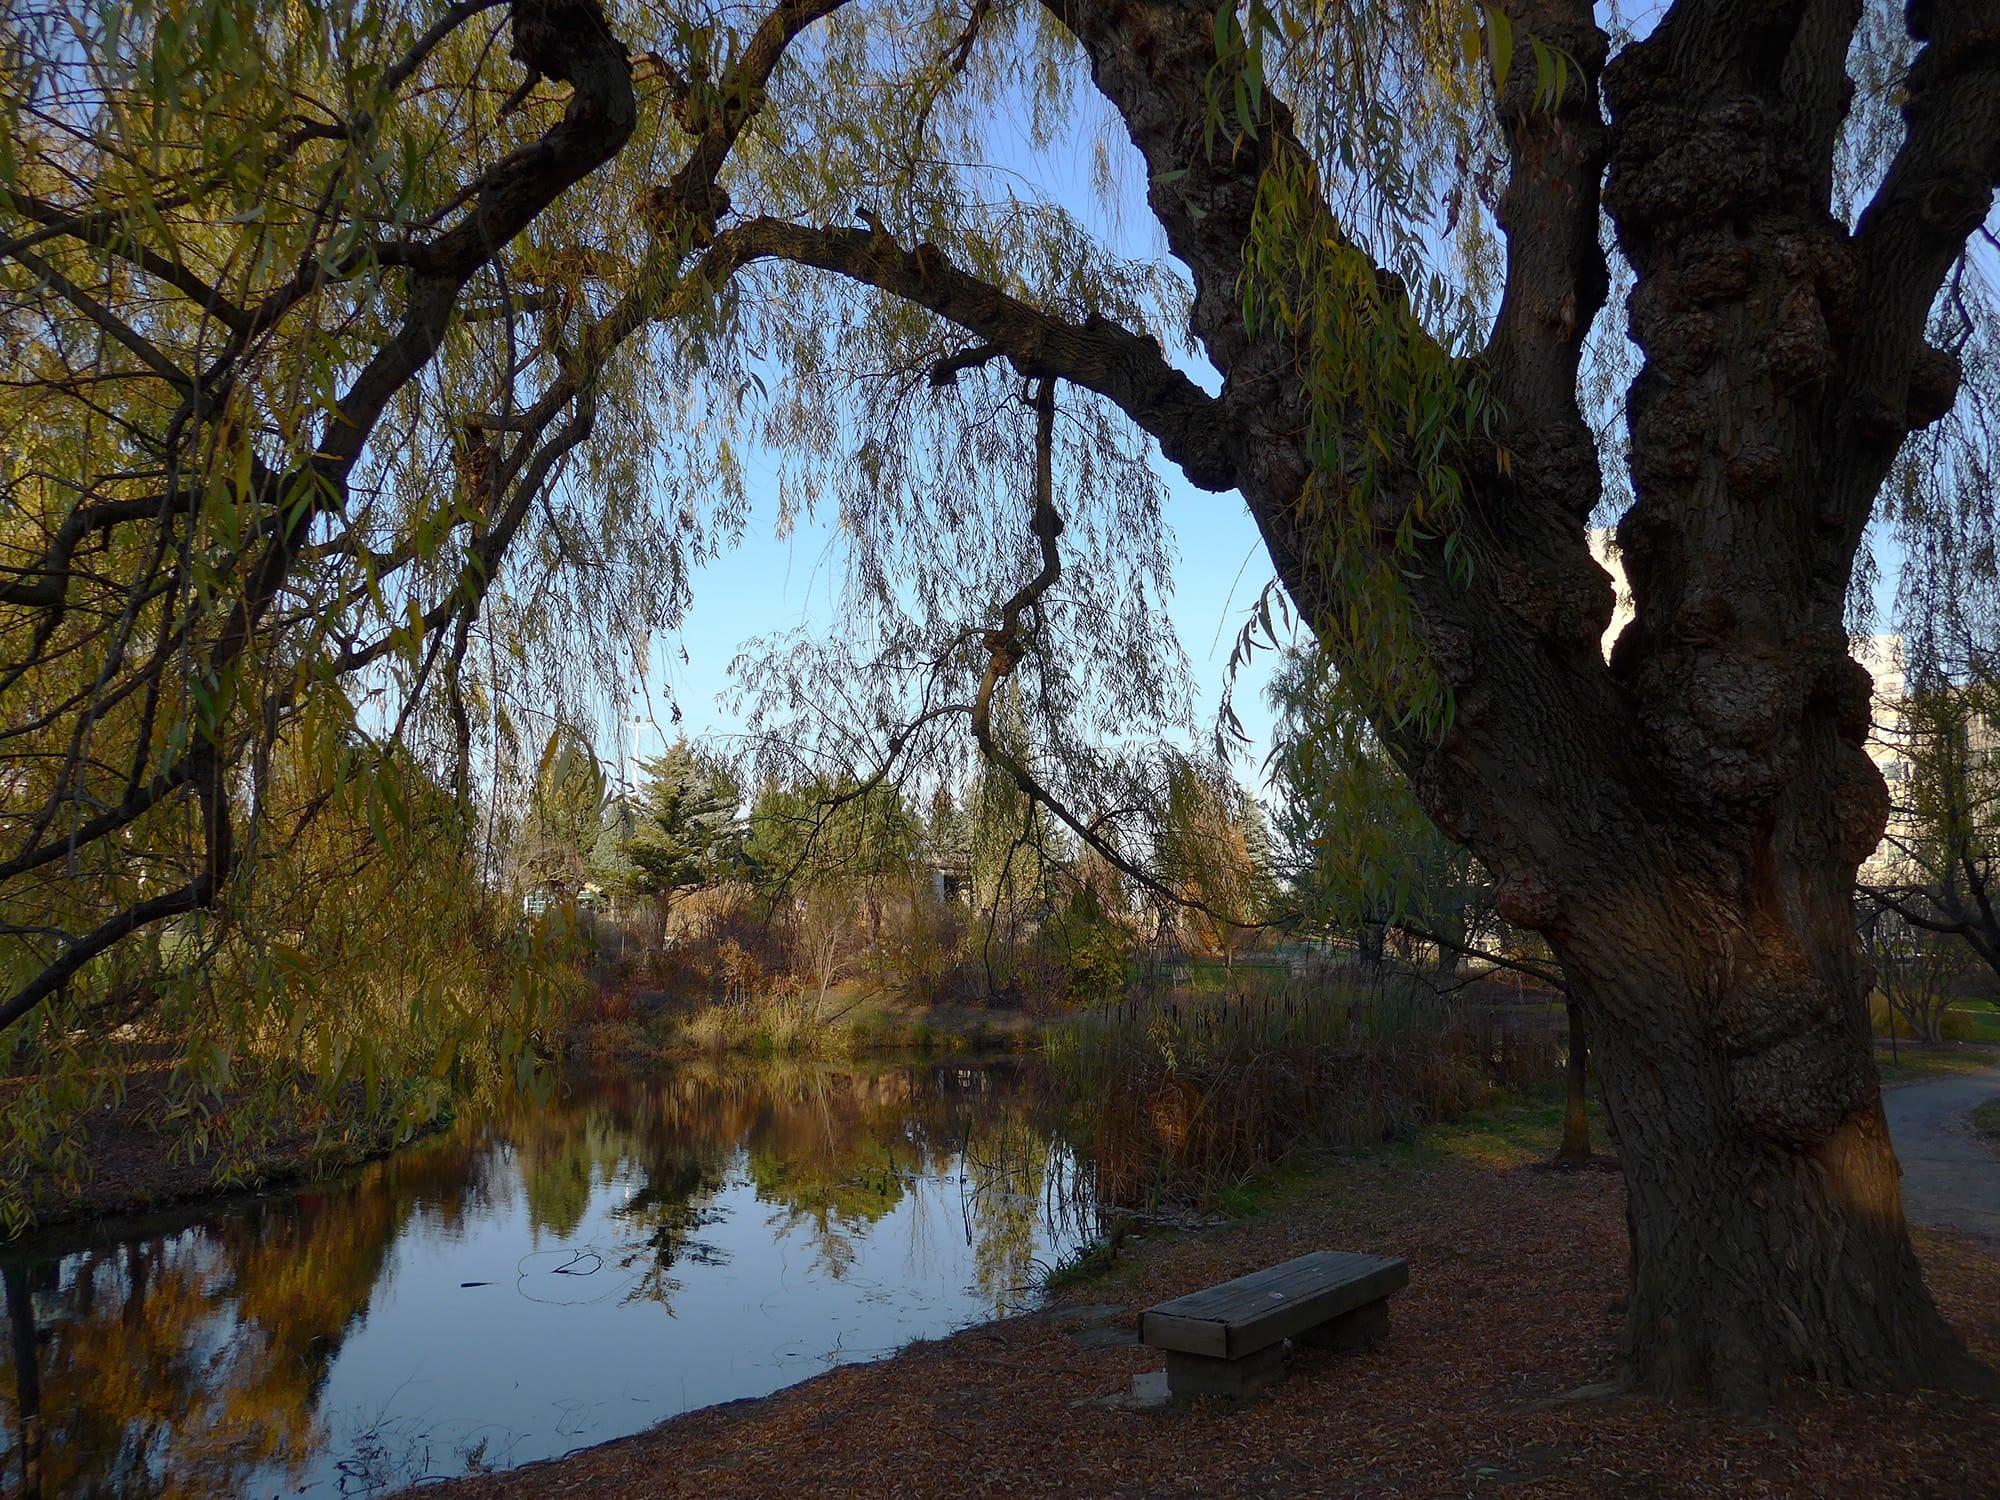
Etobicoke North
$761,976TRREB avg, Oct 2026
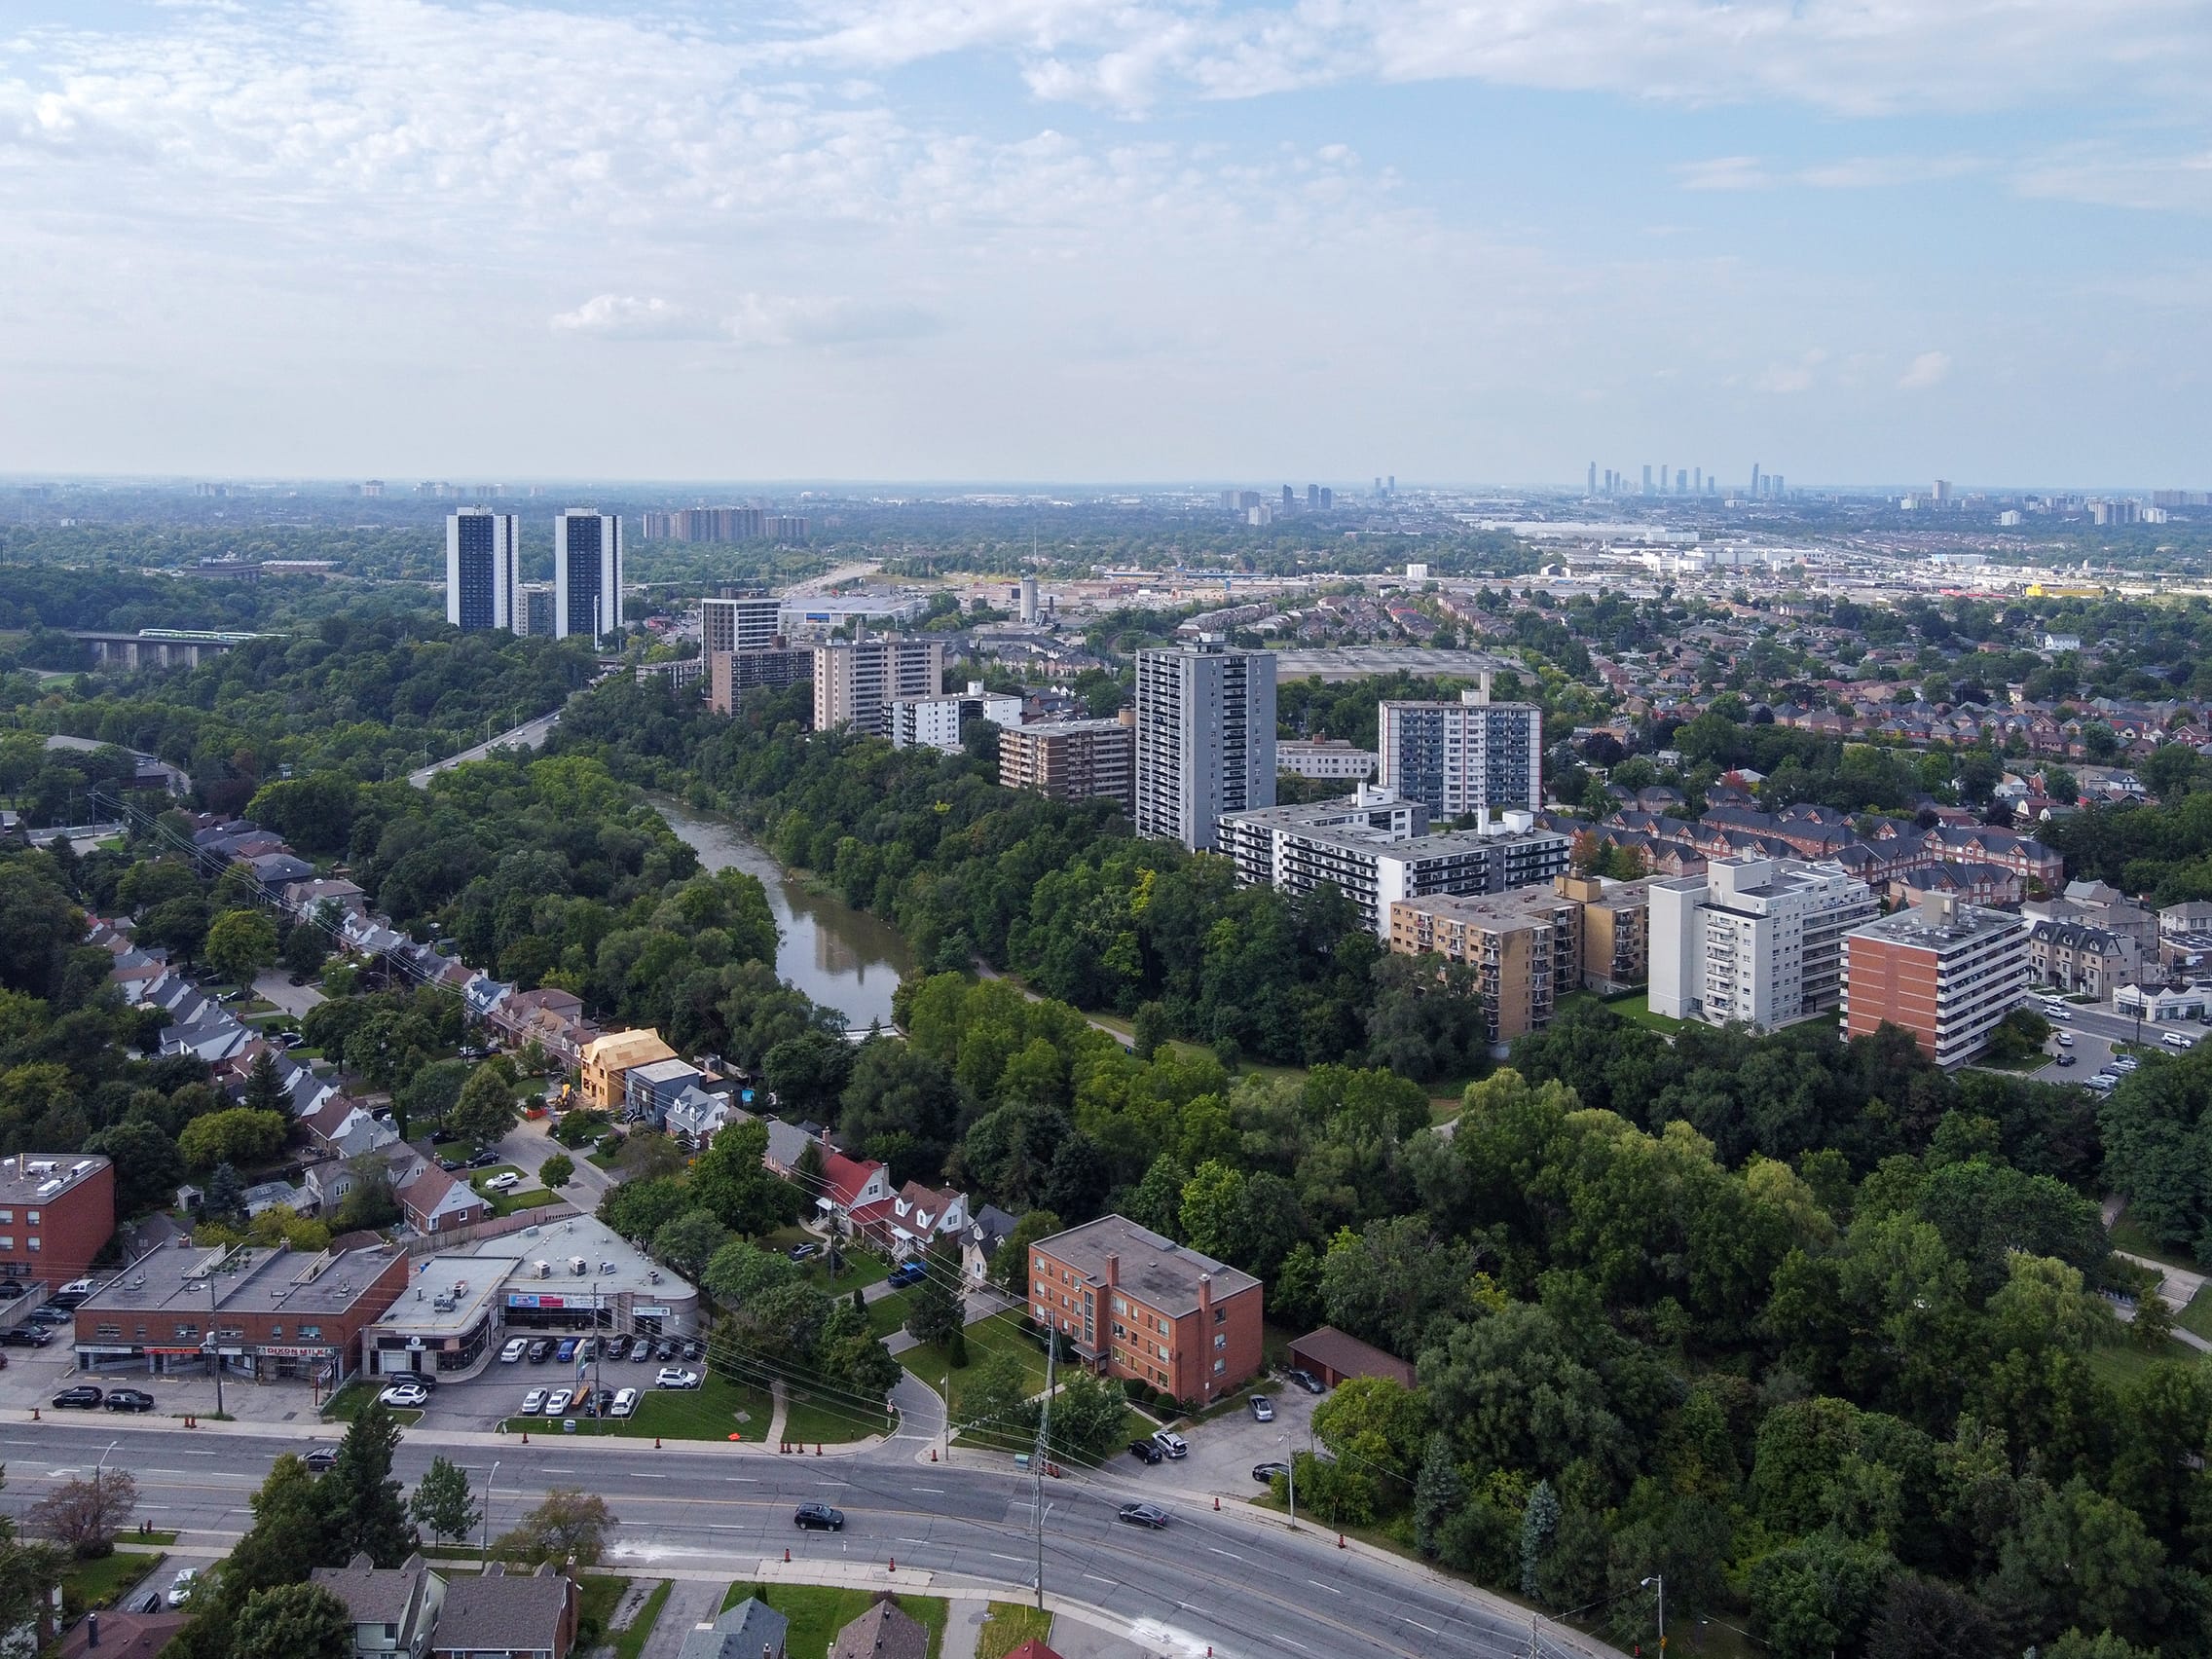
York
$808,080TRREB avg, Oct 2026
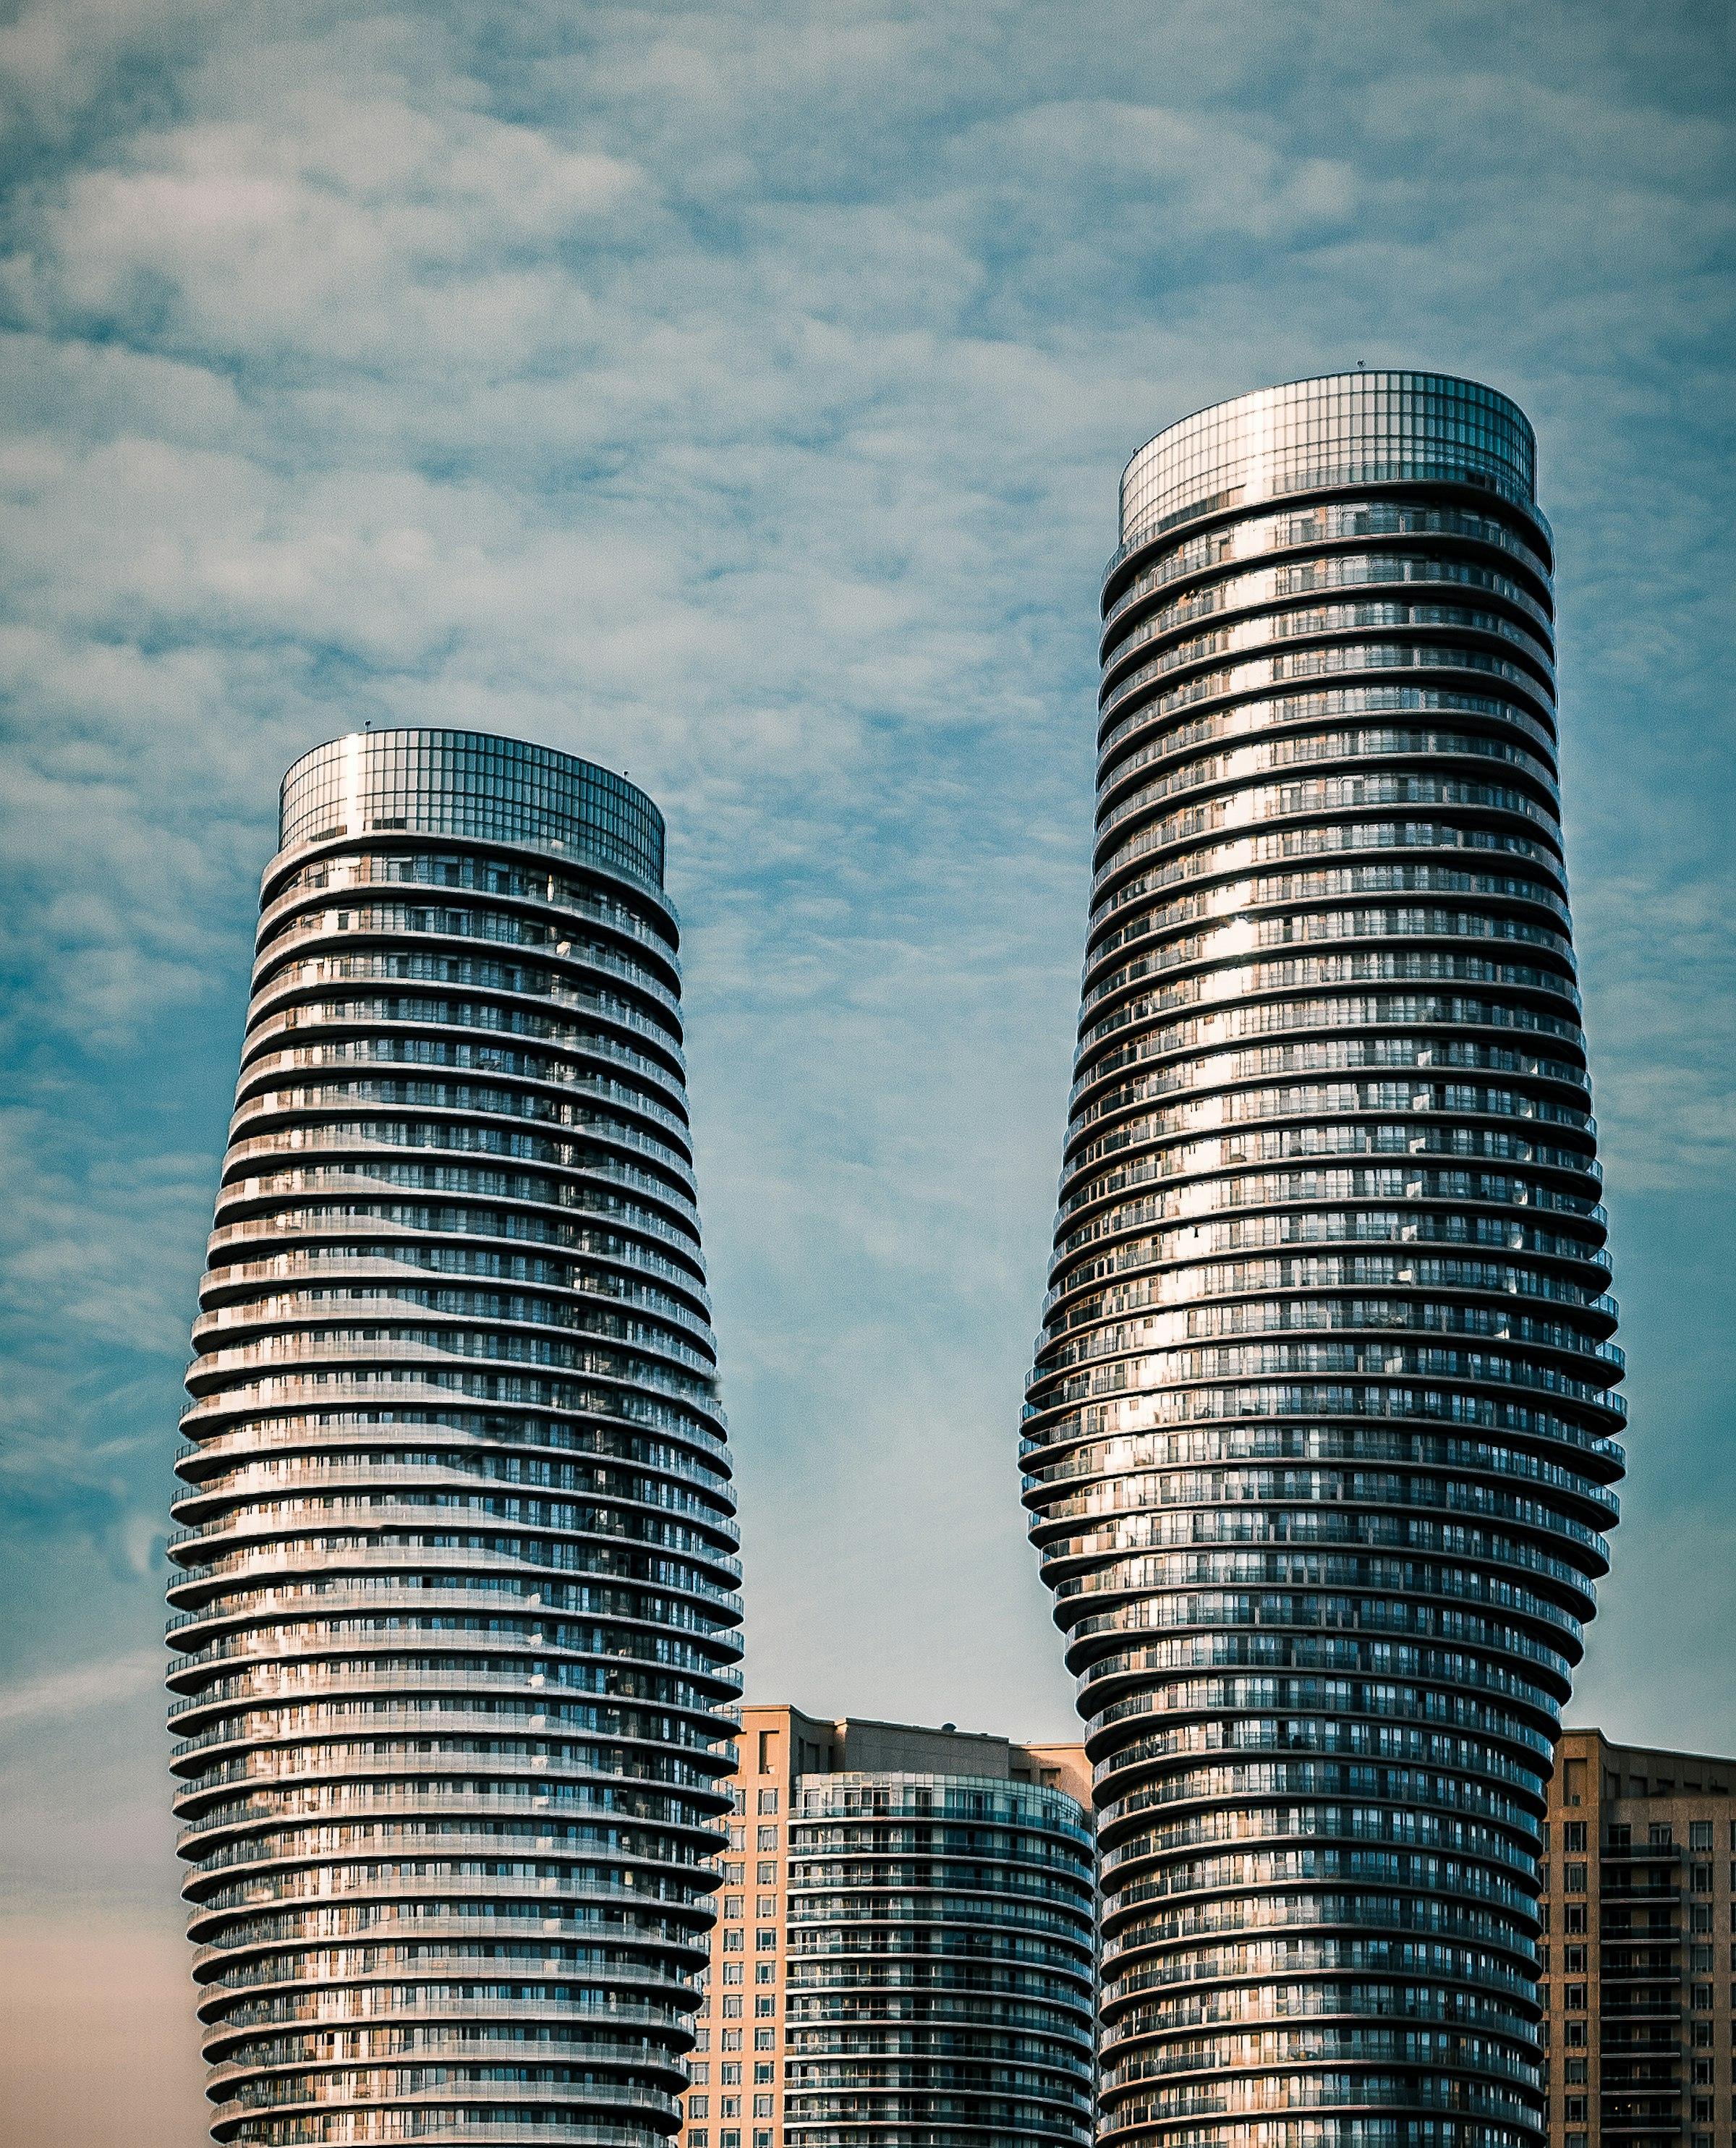
Mississauga
$927,521TRREB avg, Oct 2026
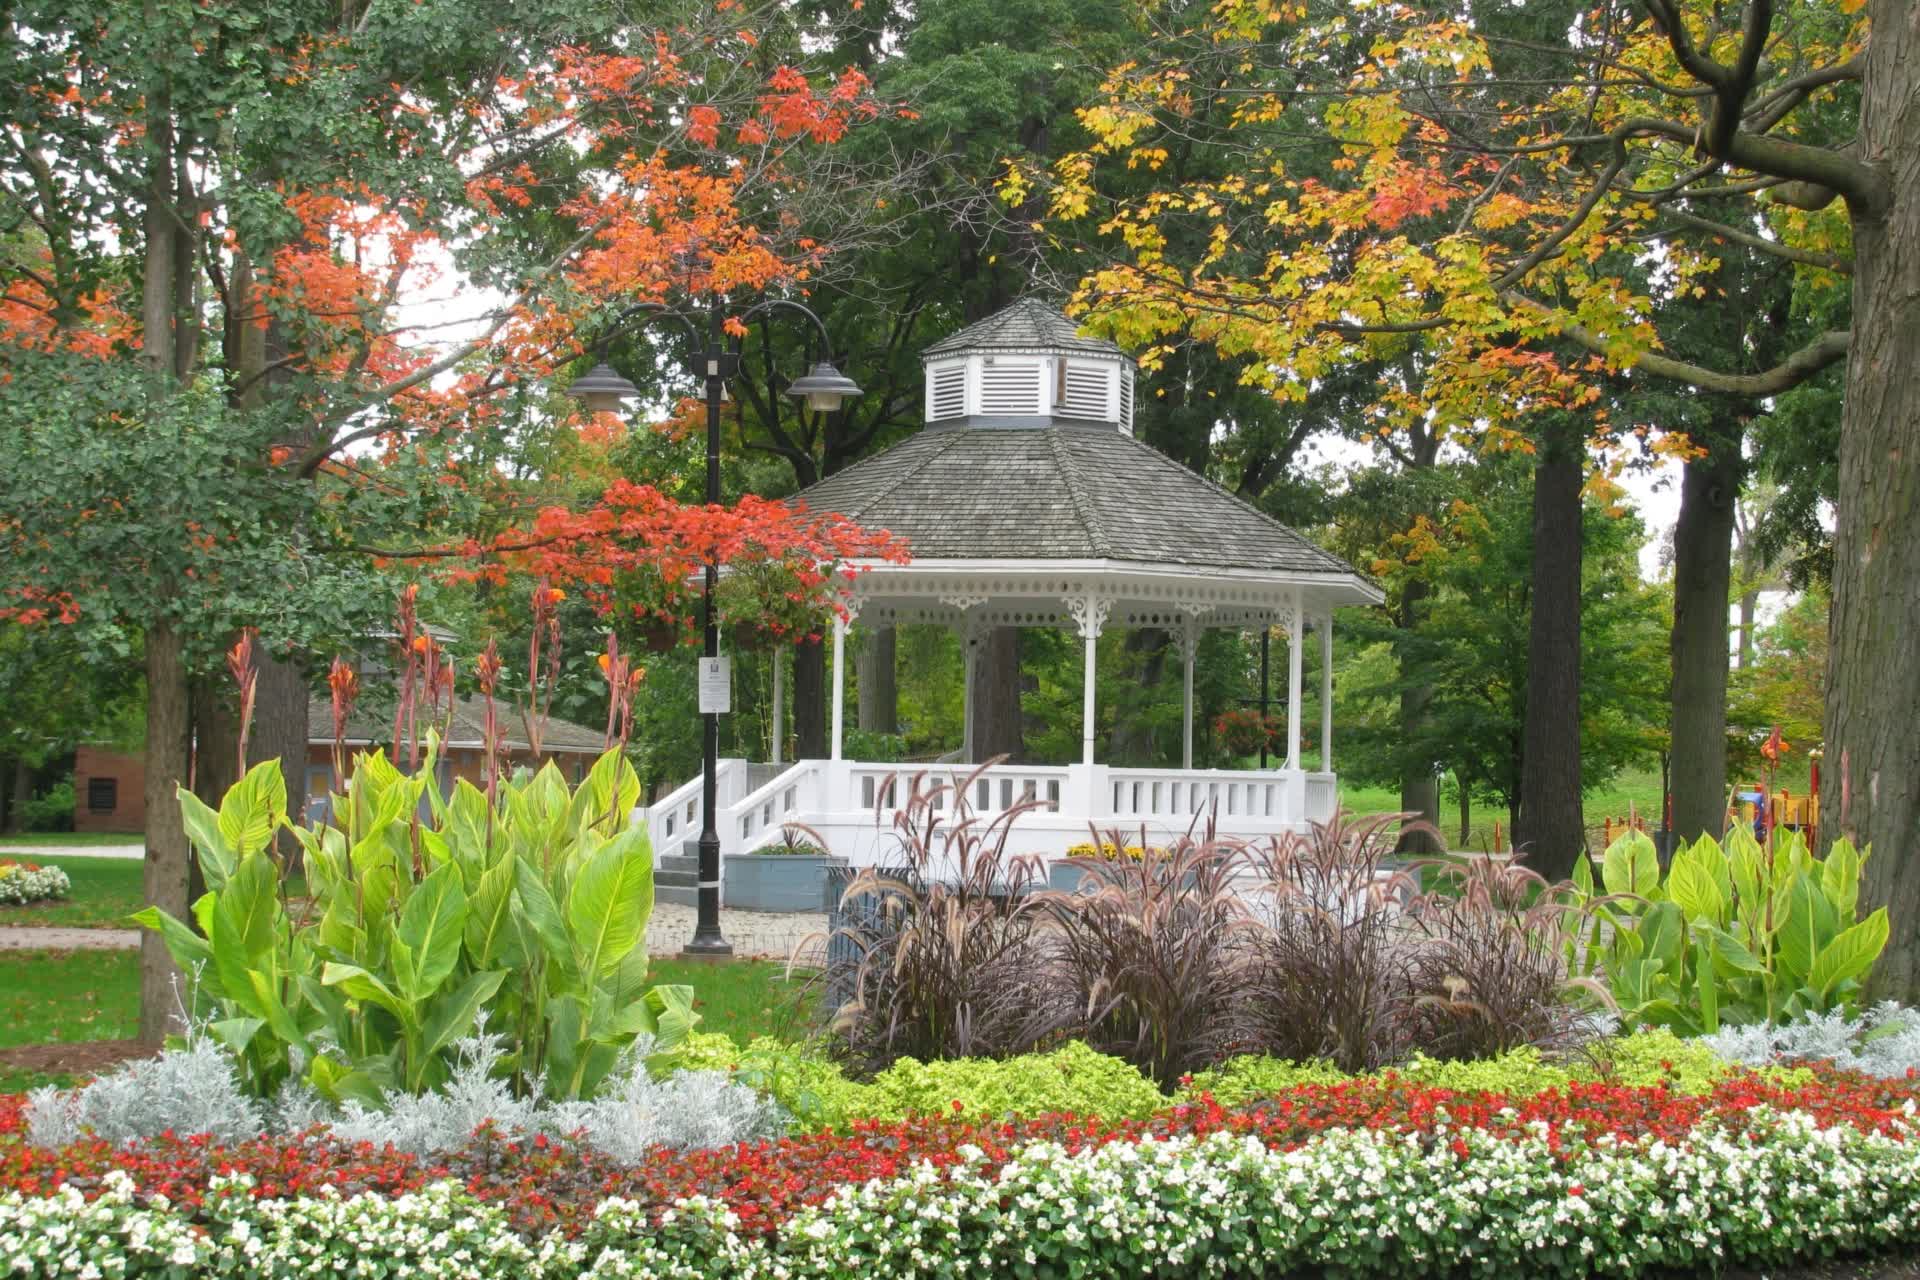
Brampton
$825,183TRREB avg, Oct 2026
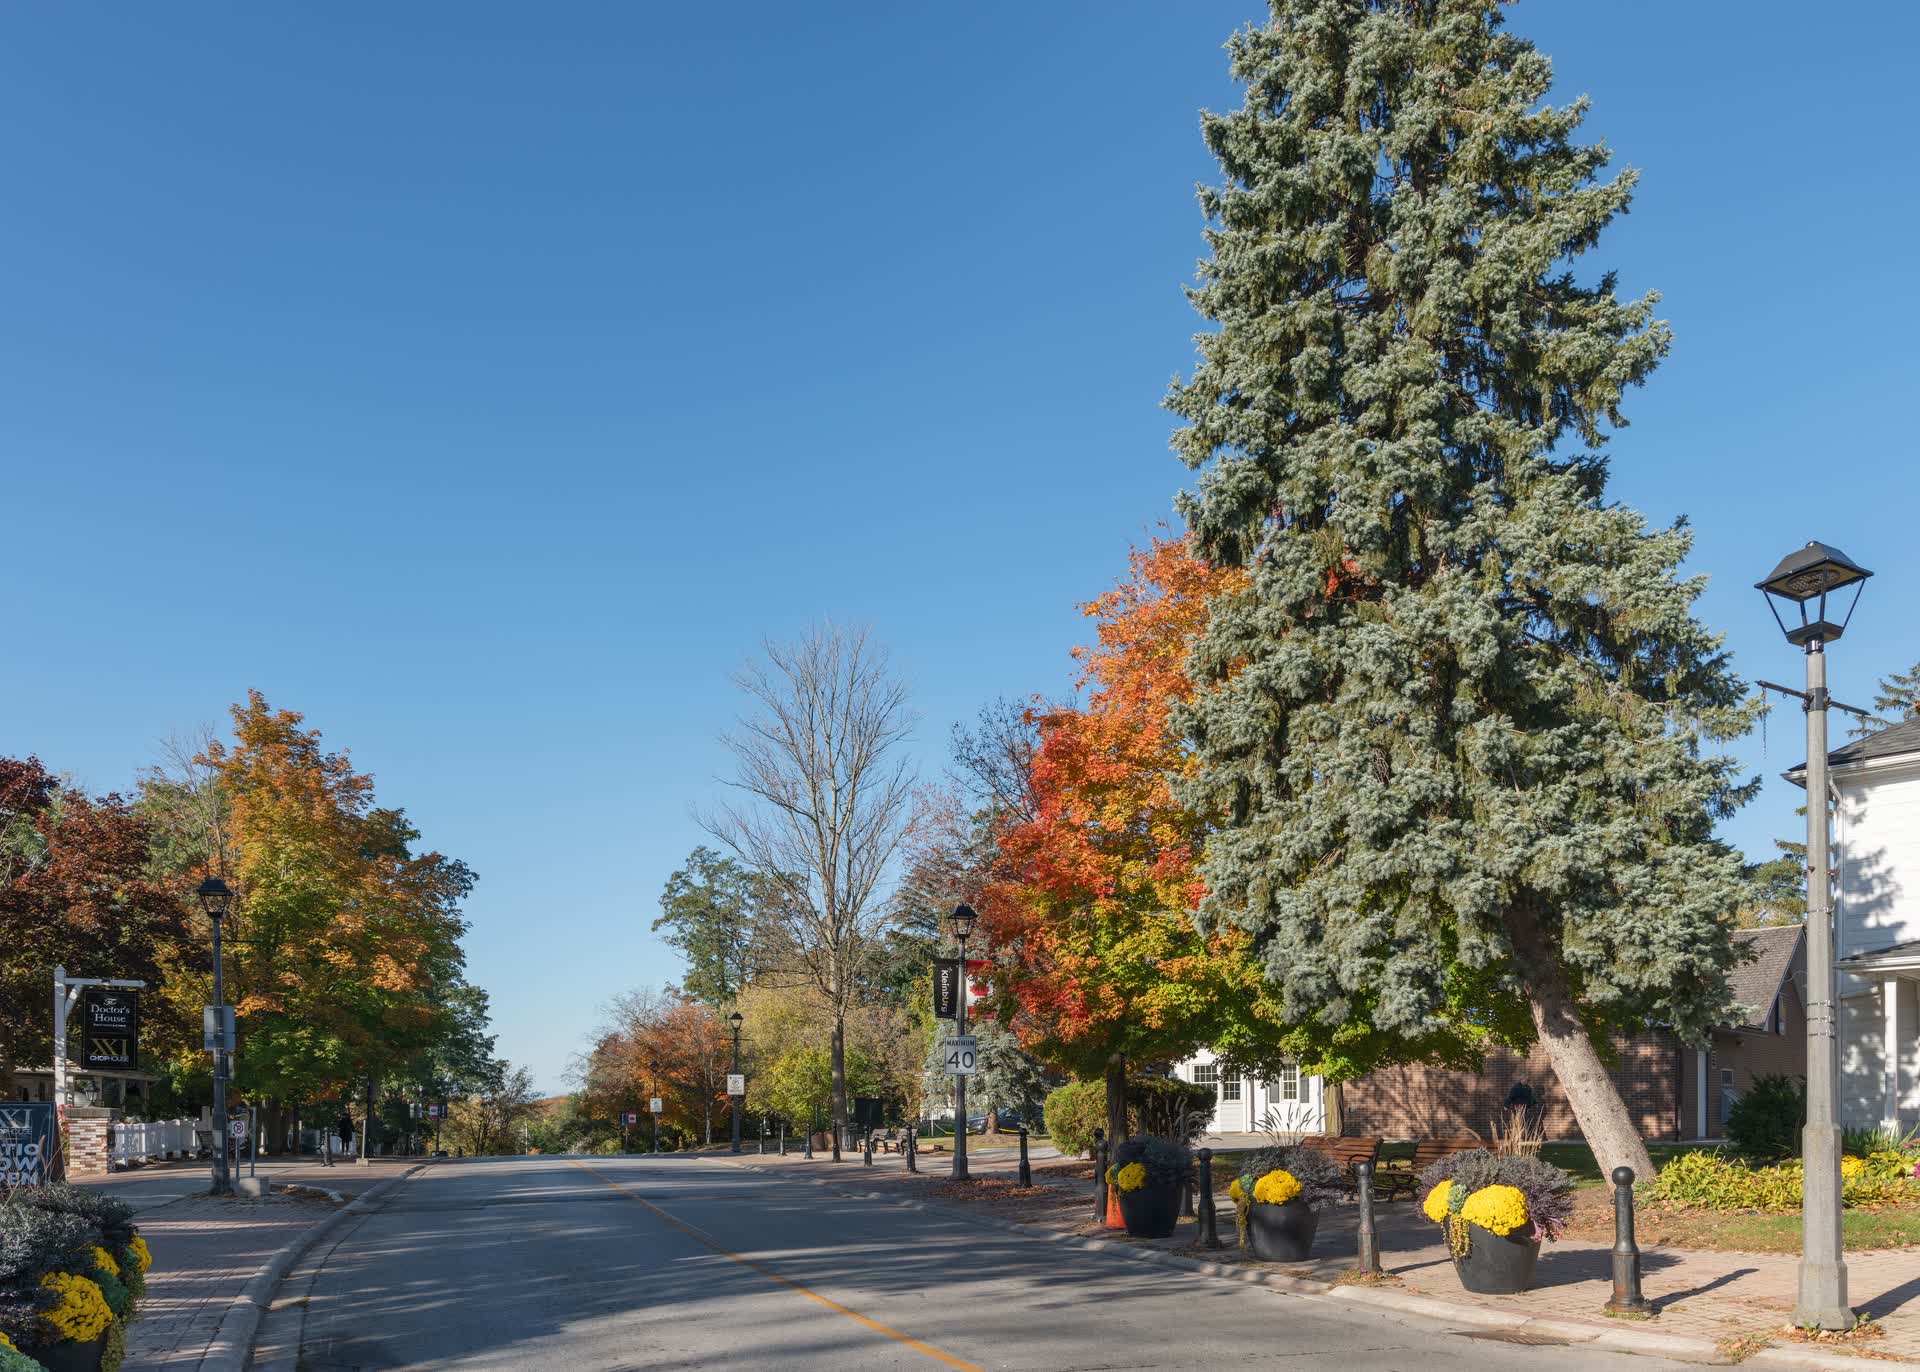
Vaughan
$1,201,704TRREB avg, Oct 2026
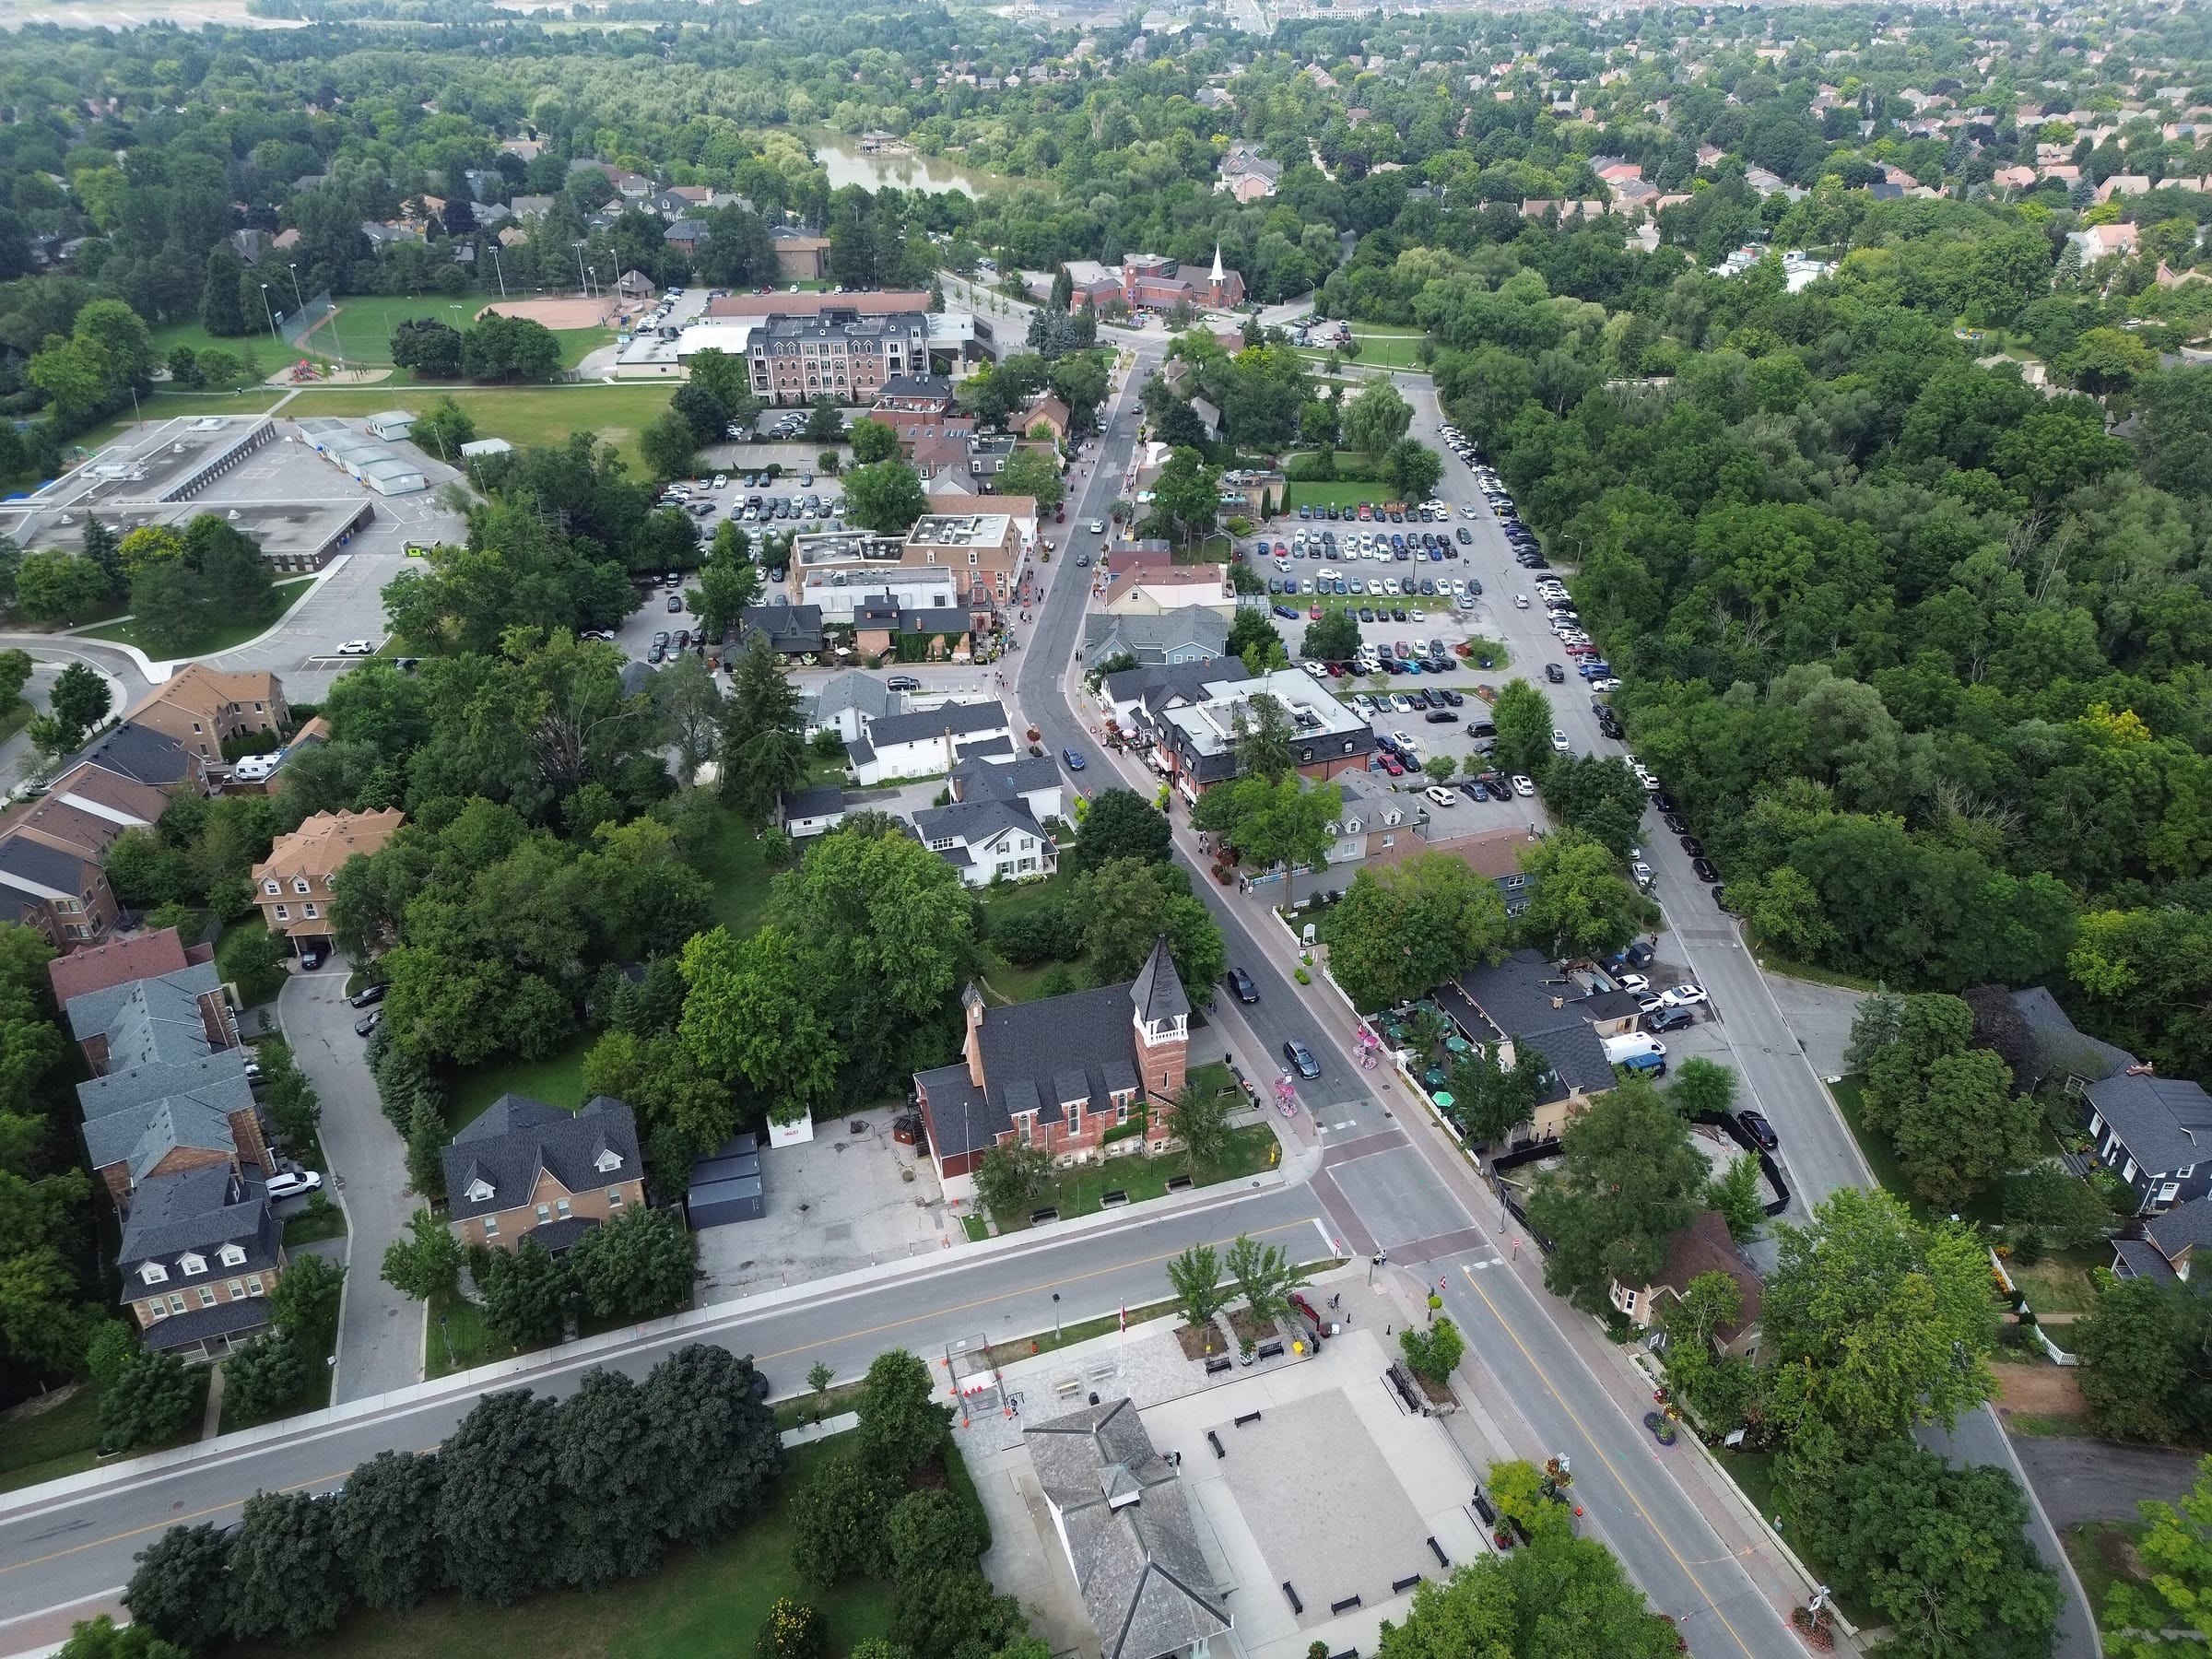
Markham
$1,117,006TRREB avg, Oct 2026
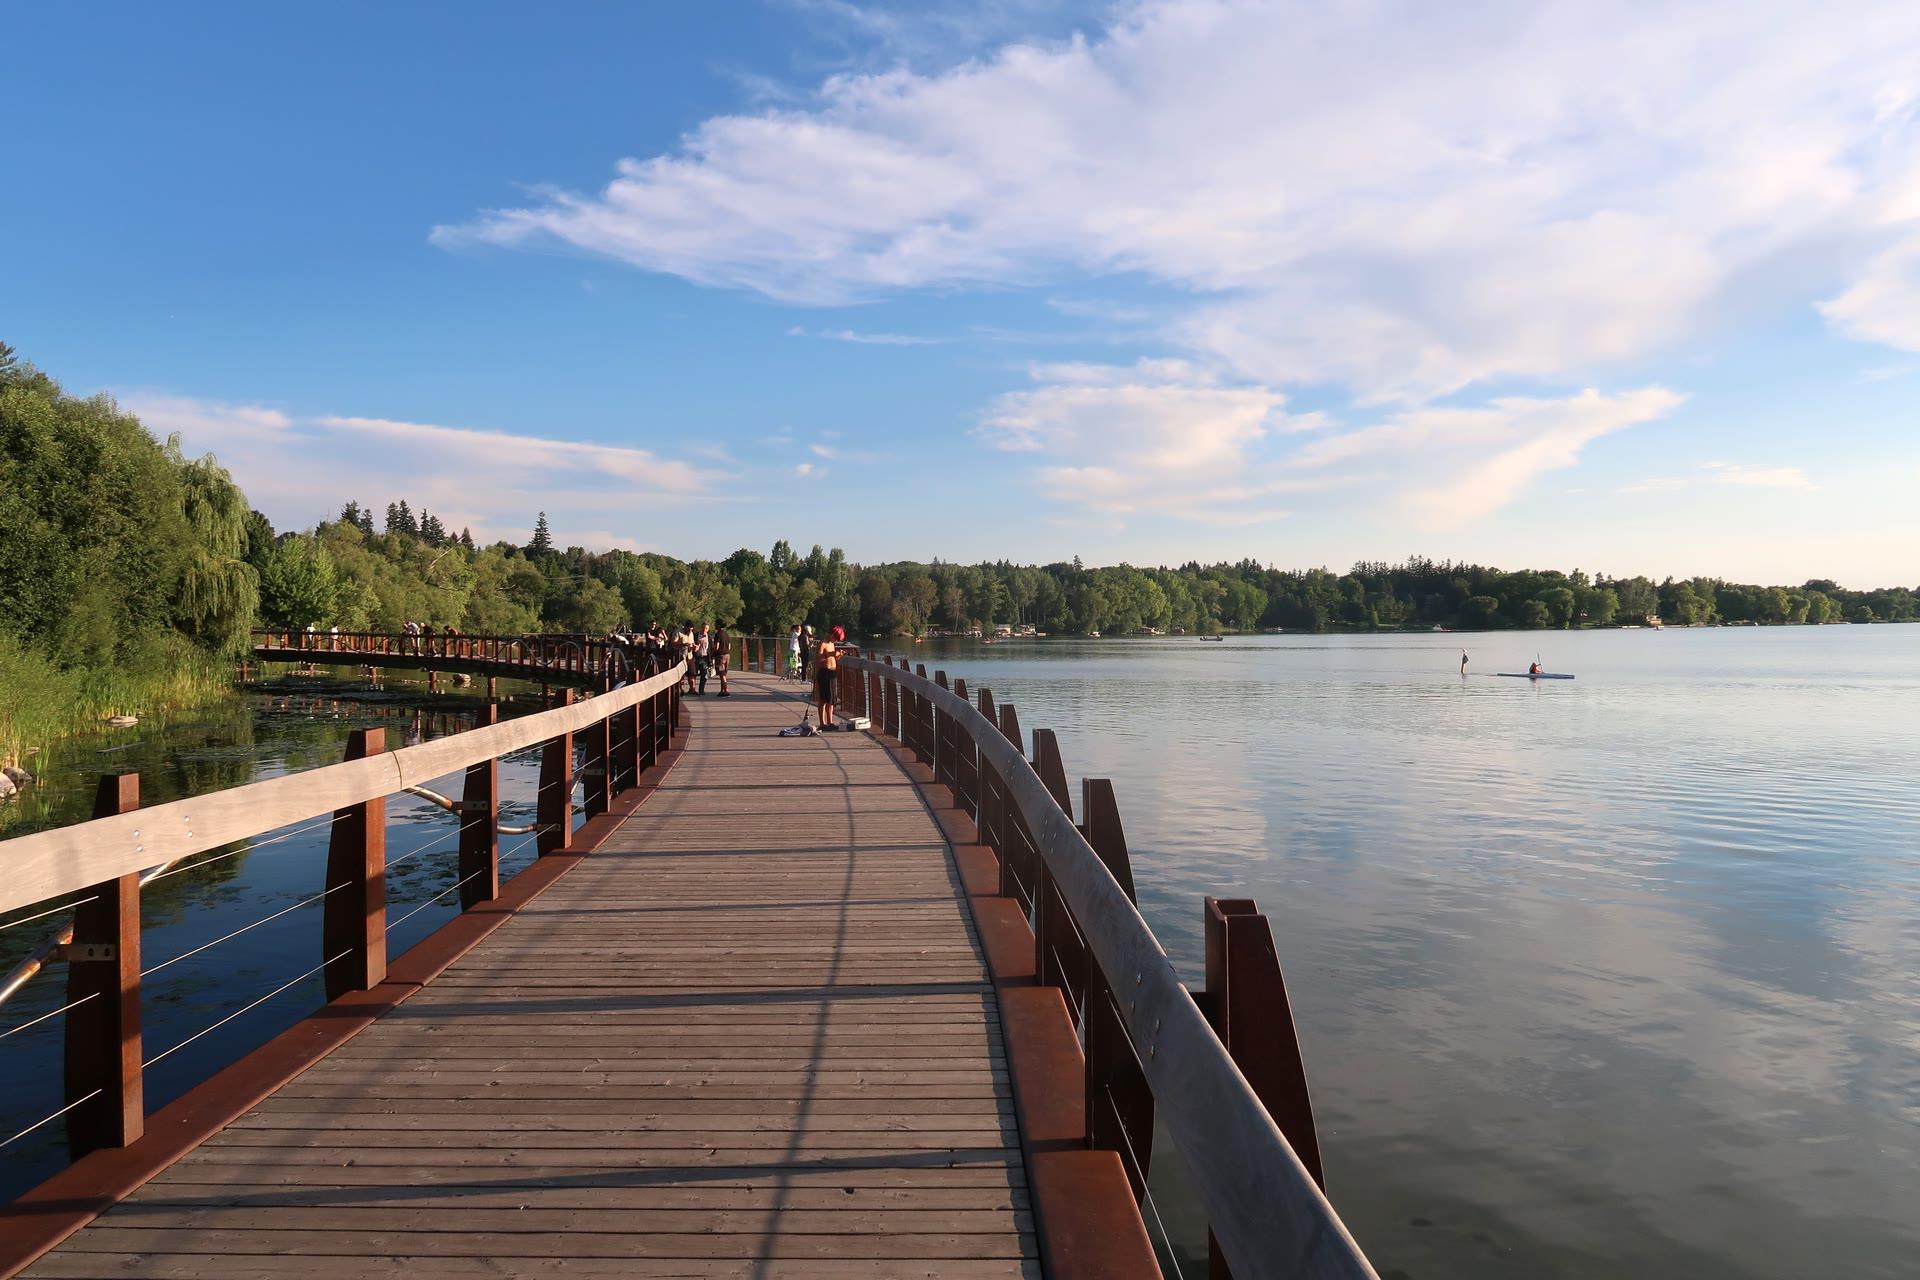
Richmond Hill
$1,193,772TRREB avg, Oct 2026
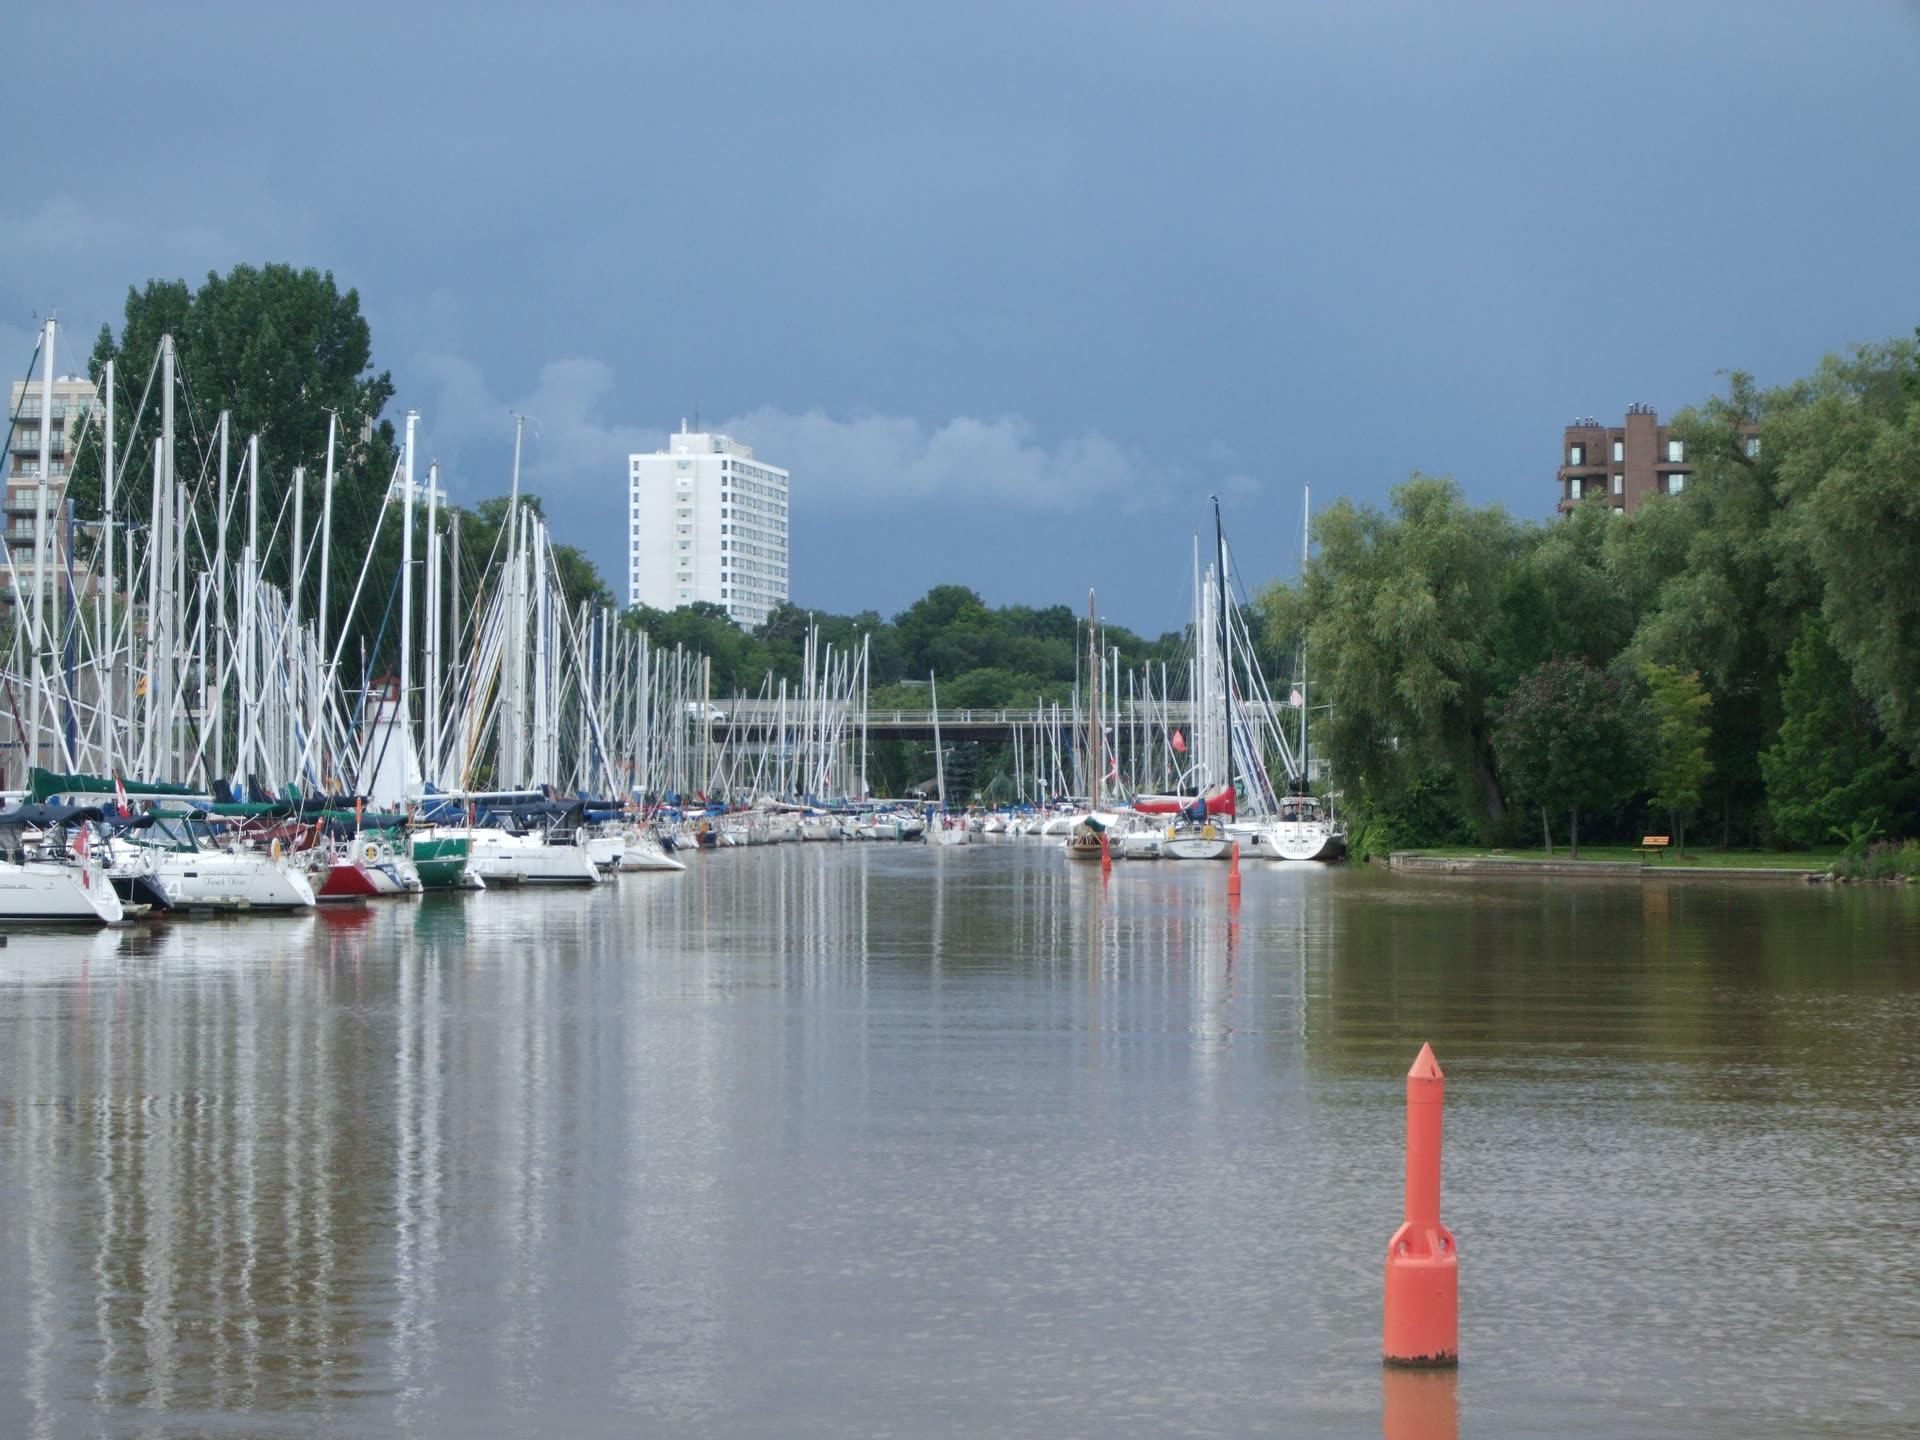
Oakville
$1,383,011TRREB avg, Oct 2026
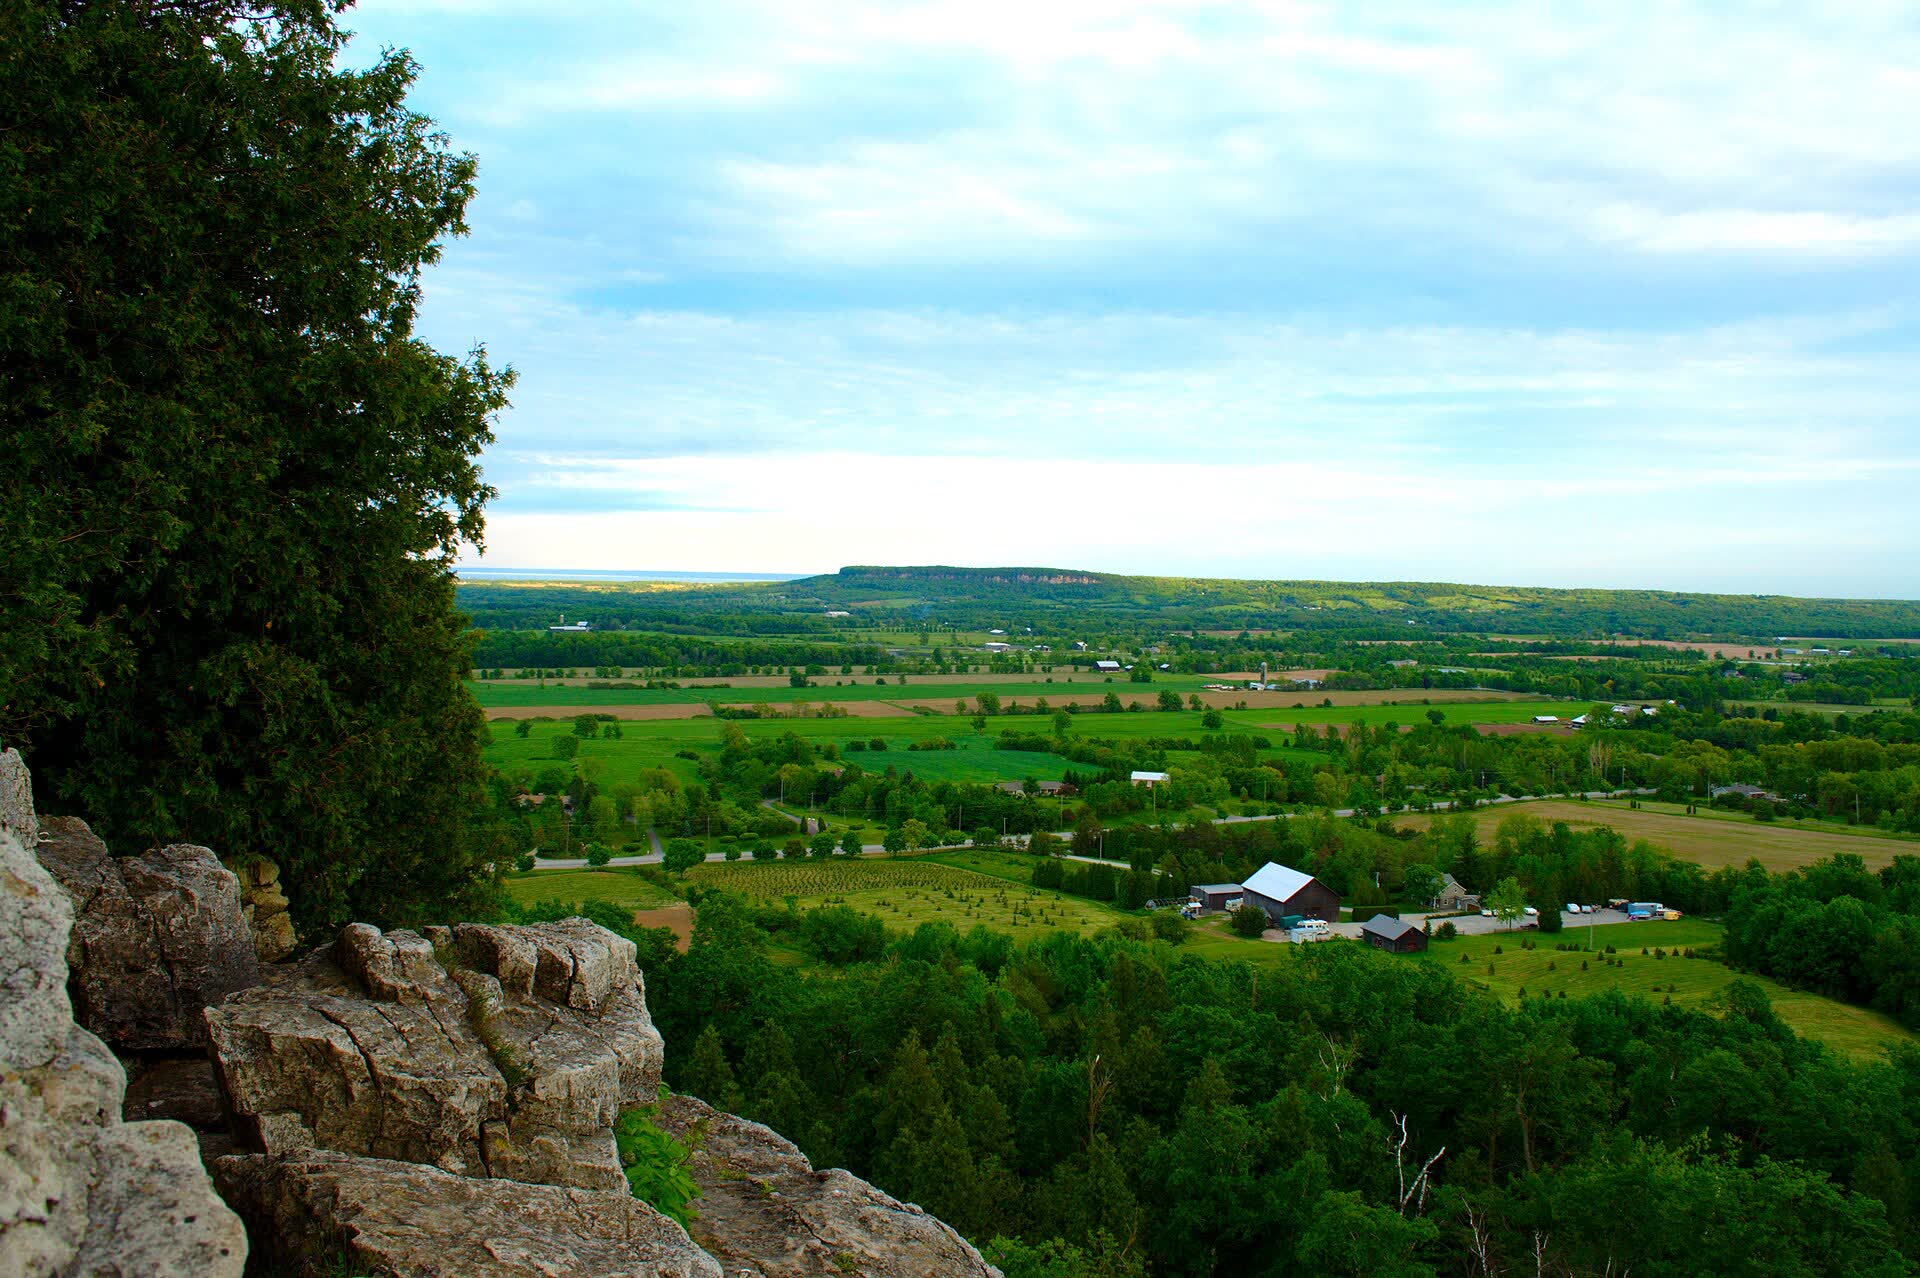
Milton
$966,412TRREB avg, Oct 2026
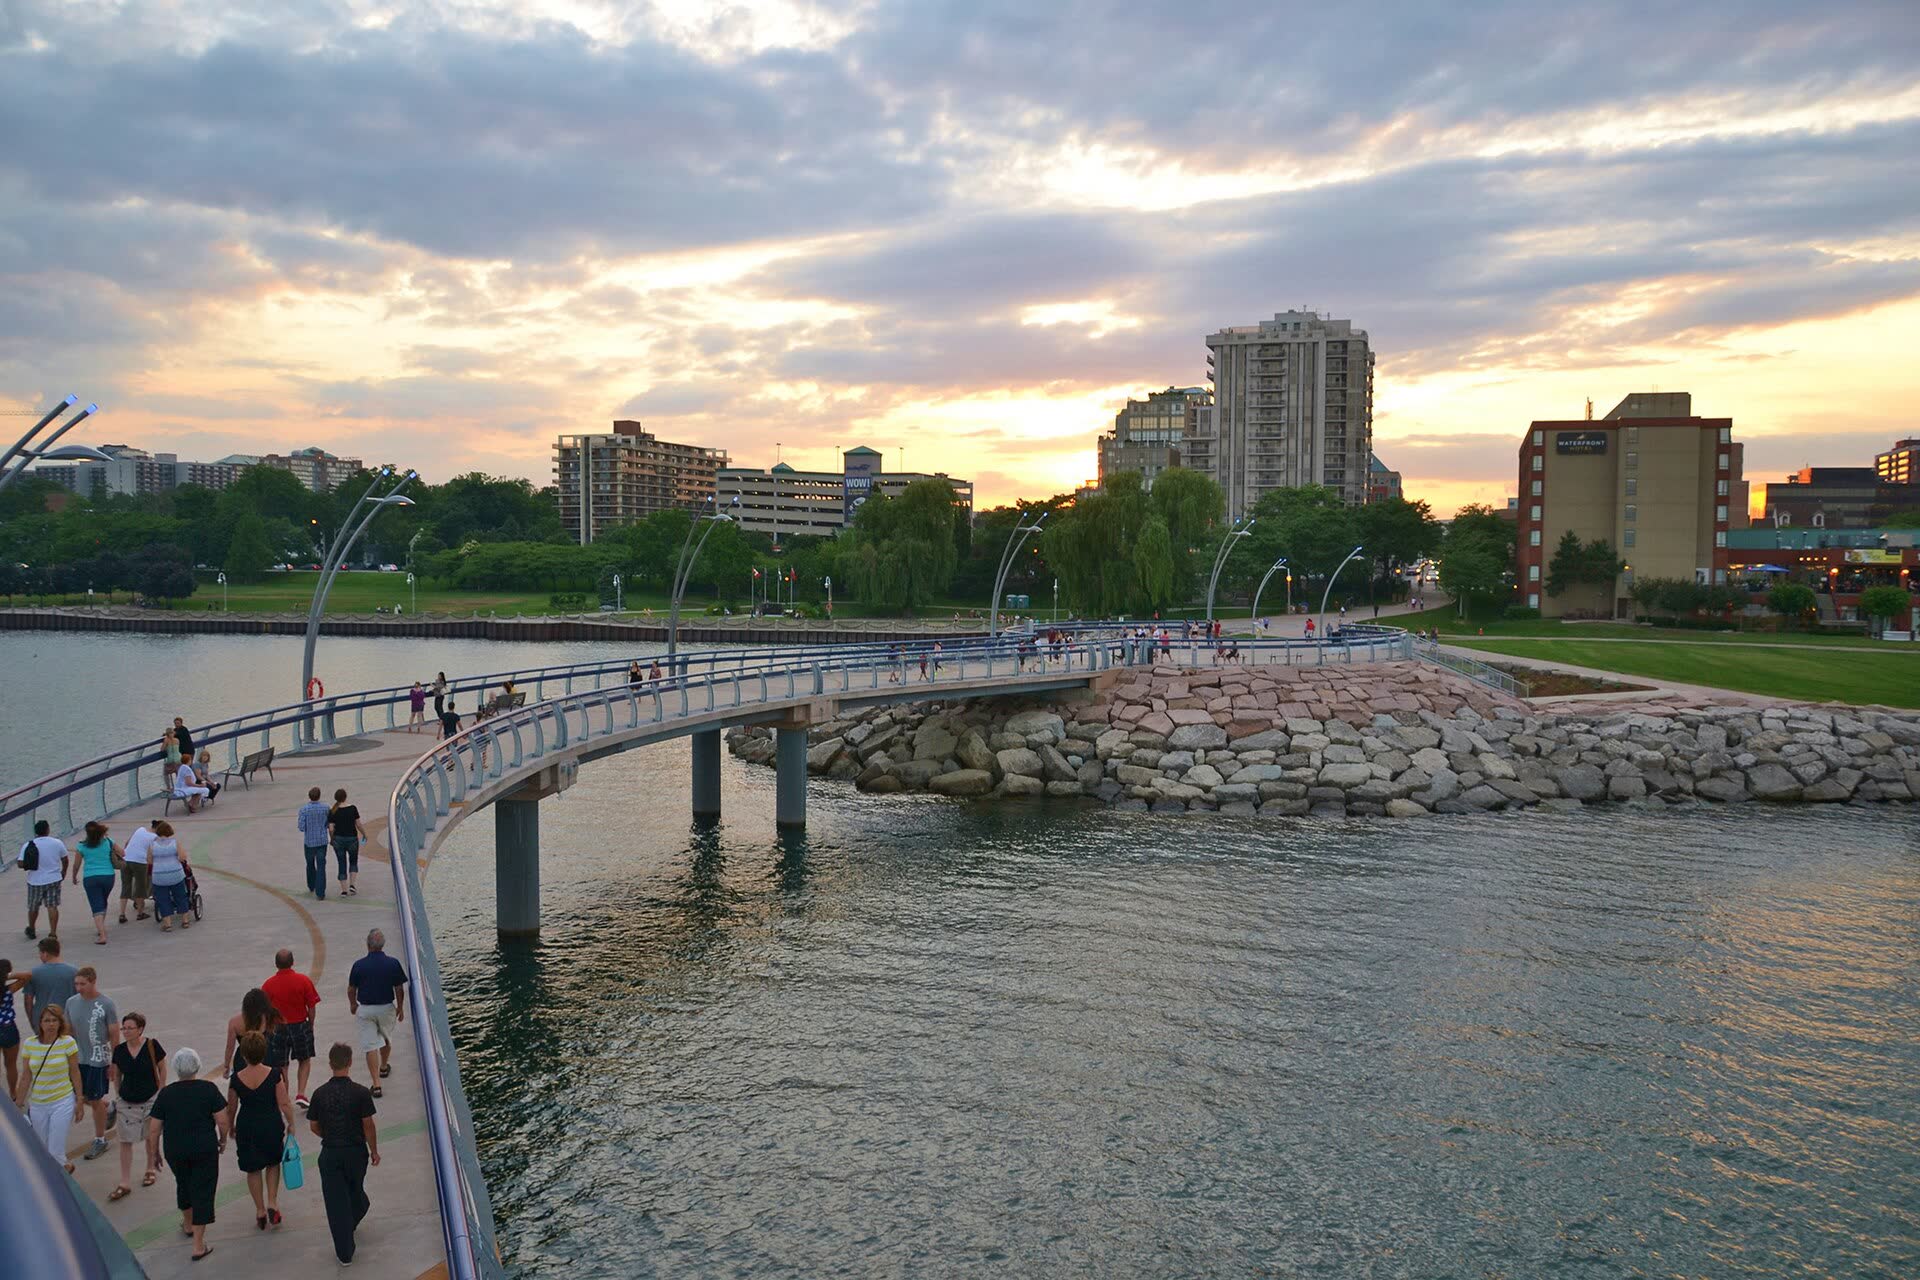
Burlington
$1,046,822TRREB avg, Oct 2026
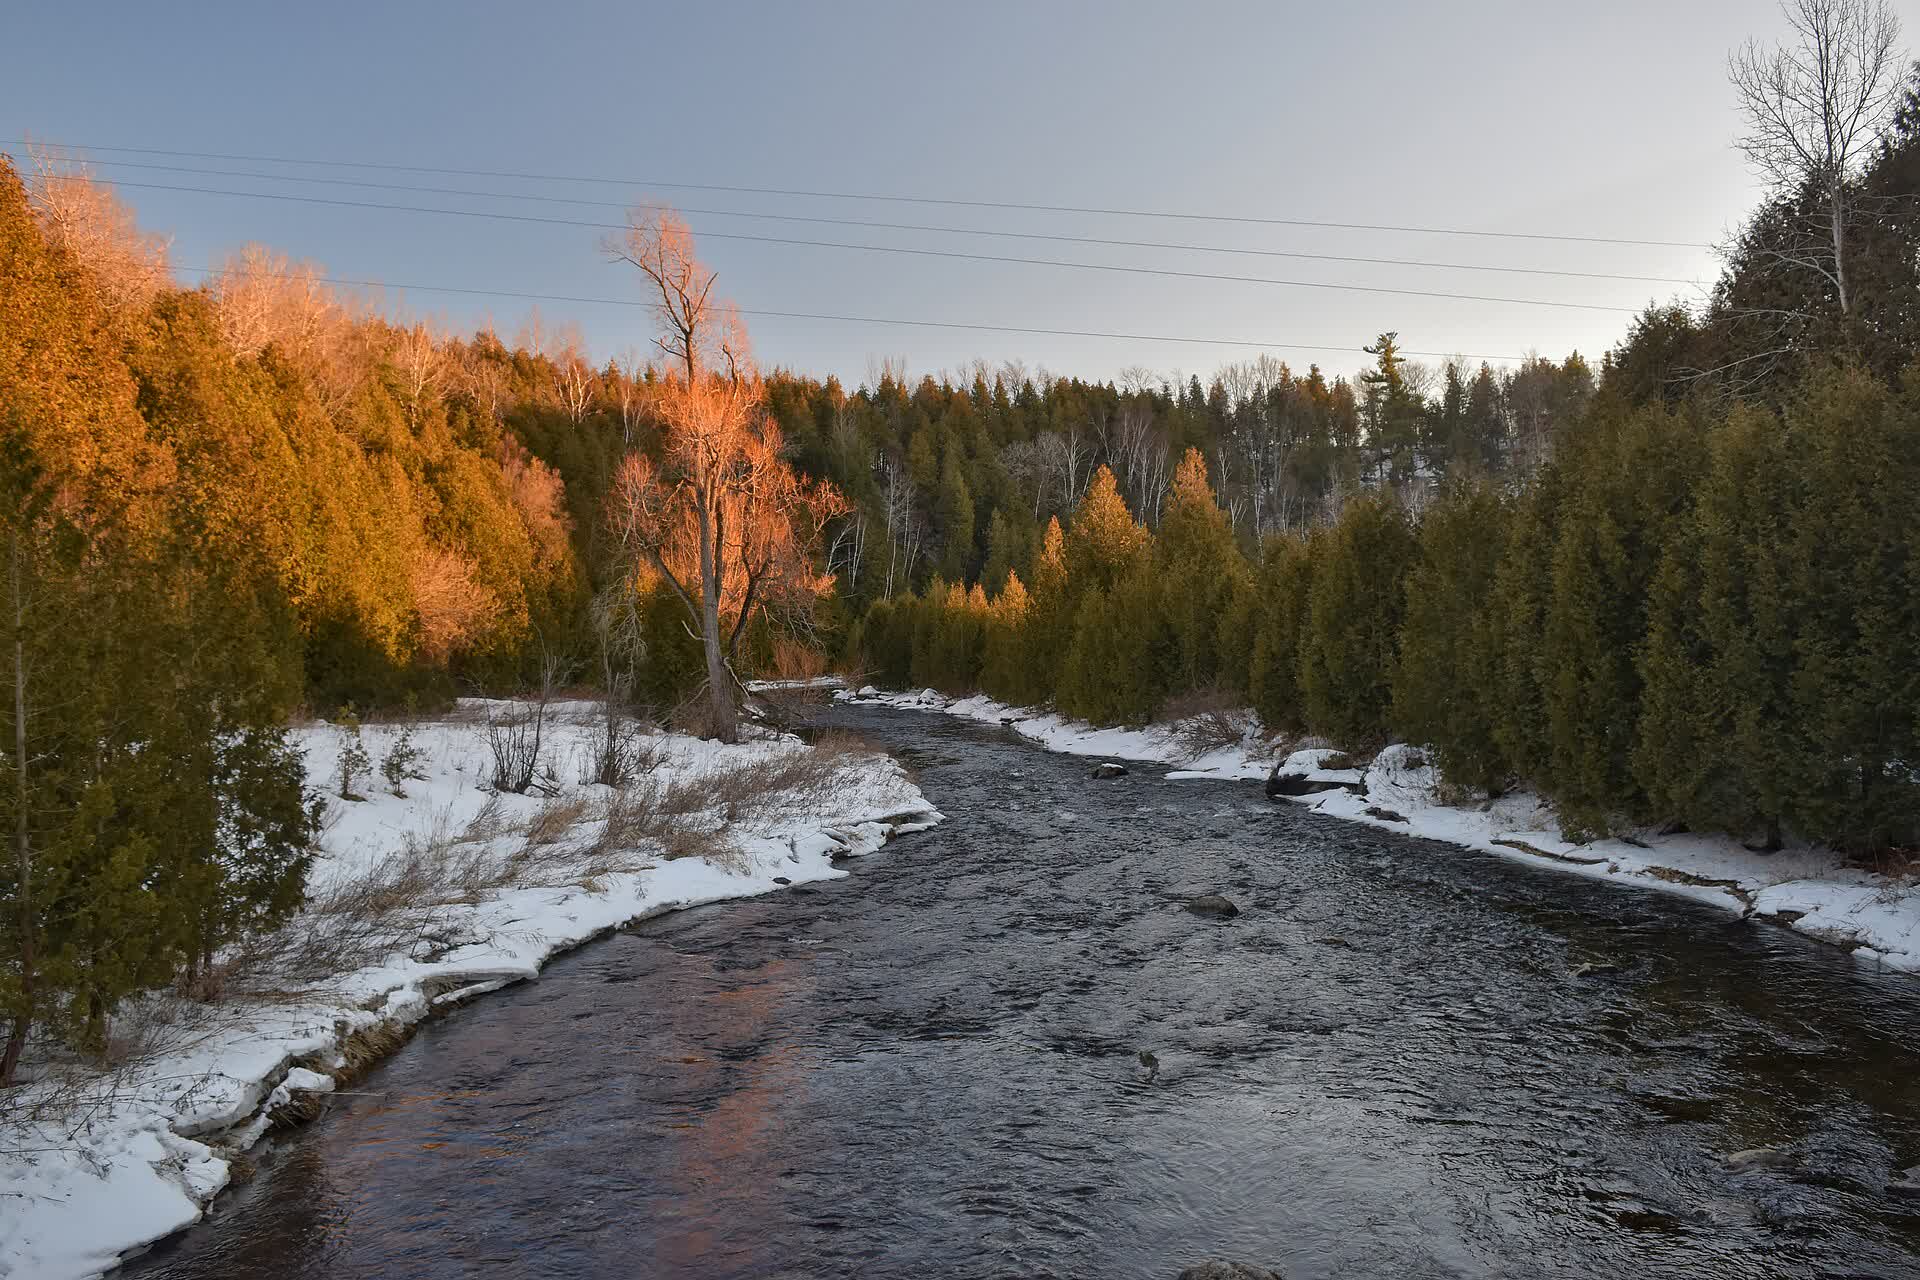
Caledon
$1,129,312TRREB avg, Oct 2026
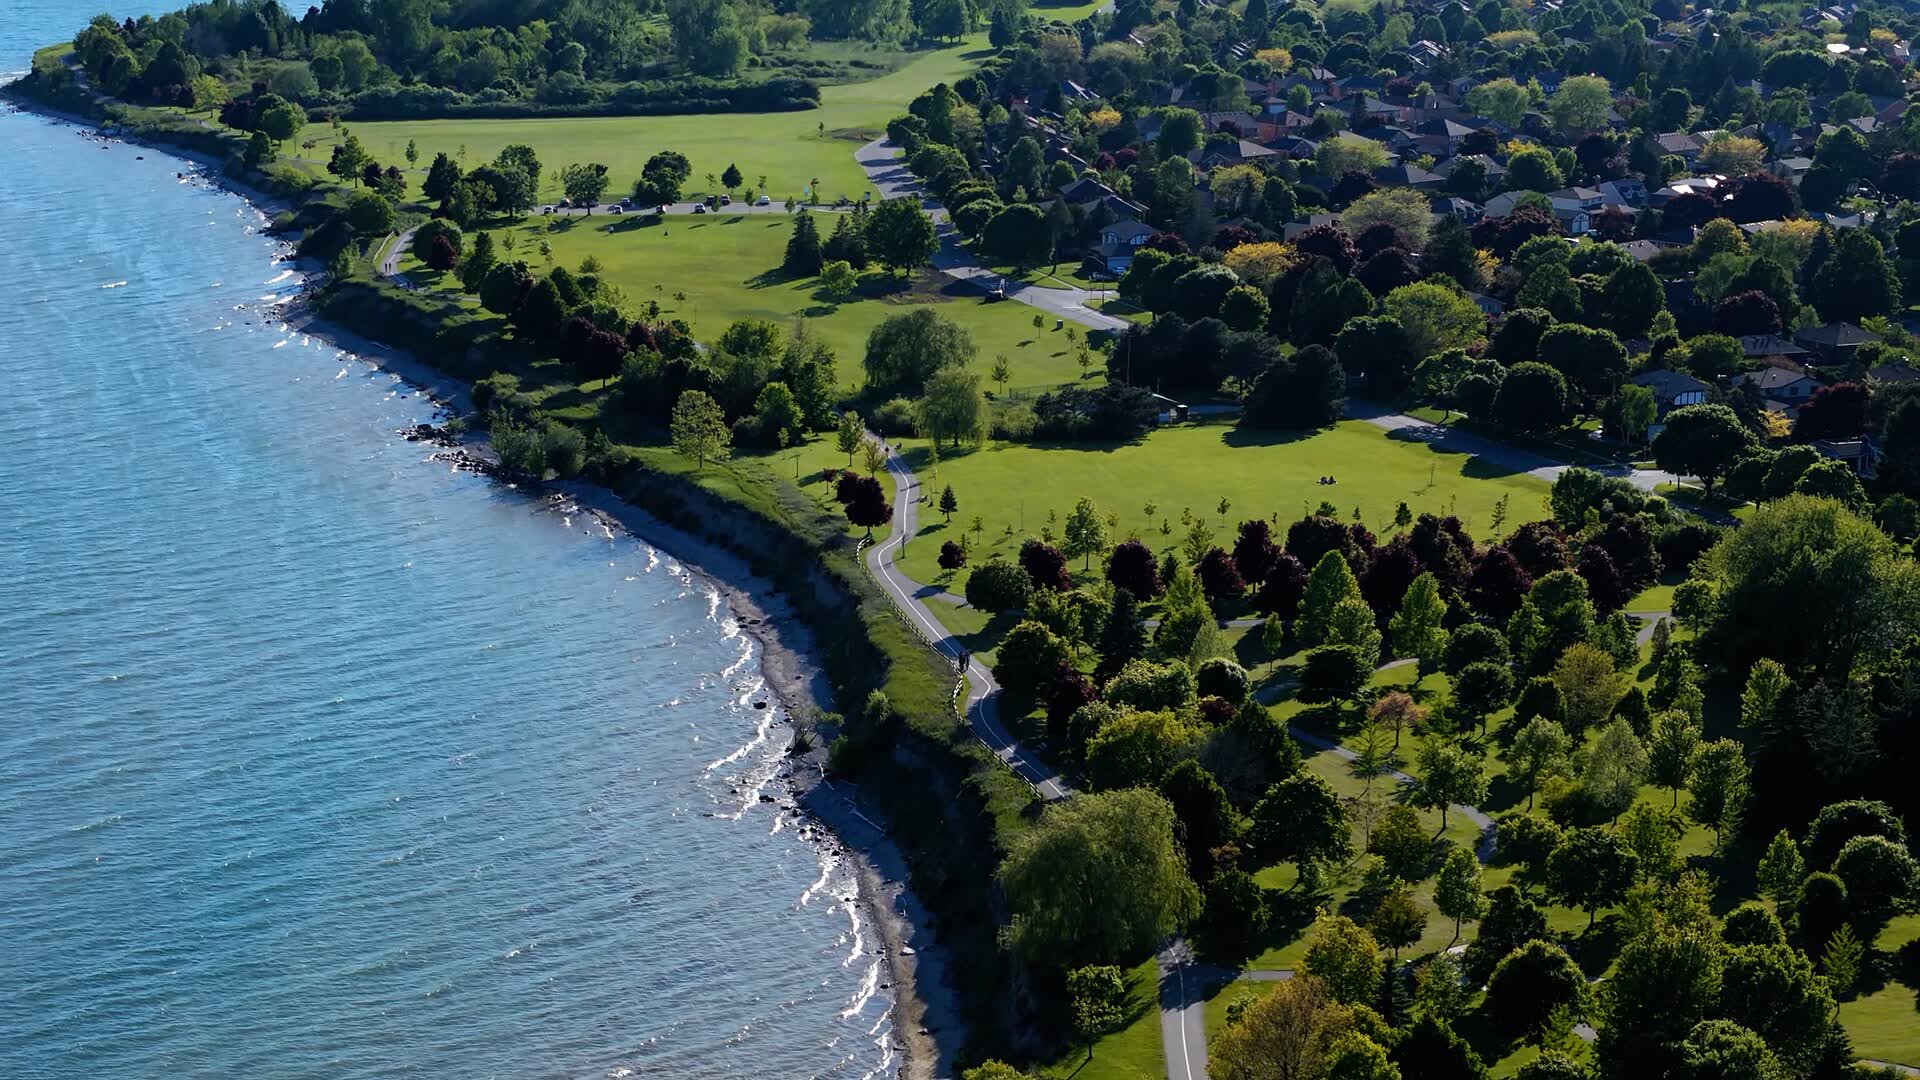
Ajax
$918,704TRREB avg, Oct 2026
Comparing a few areas?
Prices, commute and schools for your shortlist, side by side in one free session.
Average prices, side by side
TRREB average sale price, October 2026. Highest first.
- Oakville$1,383,011$1,383,011
- Vaughan$1,201,704$1,201,704
- Richmond Hill$1,193,772$1,193,772
- Caledon$1,129,312$1,129,312
- Markham$1,117,006$1,117,006
- Toronto$1,075,627$1,075,627
- Burlington$1,046,822$1,046,822
- North York(7 districts)$1,016,520$1,016,520
- Milton$966,412$966,412
- Etobicoke(W06 to W10)$965,845$965,845
- Mississauga$927,521$927,521
- Ajax$918,704$918,704
- Brampton$825,183$825,183
- Scarborough(E04 to E11)$814,444$814,444
- York(W03 and W04)$808,080$808,080
- Etobicoke North(W10)$761,976$761,976
TRREB Market Watch, October 2026. Toronto areas cover the TRREB districts noted. An area is left out of a home type when its guide has no TRREB average for it. Averages move with the mix of homes that sold, so a few sales can swing a small area.
Not sure which area fits?
Budget, commute, must-haves: one session narrows the GTA to two or three areas.
Or call 437-525-2544