Buying
Land Transfer Tax in Toronto and Ontario, With Examples
Ontario and Toronto land transfer tax rates, first-time buyer refunds, and worked examples at $700K, $1M and $1.3M, with every step of the math shown.
Updated 6 min read
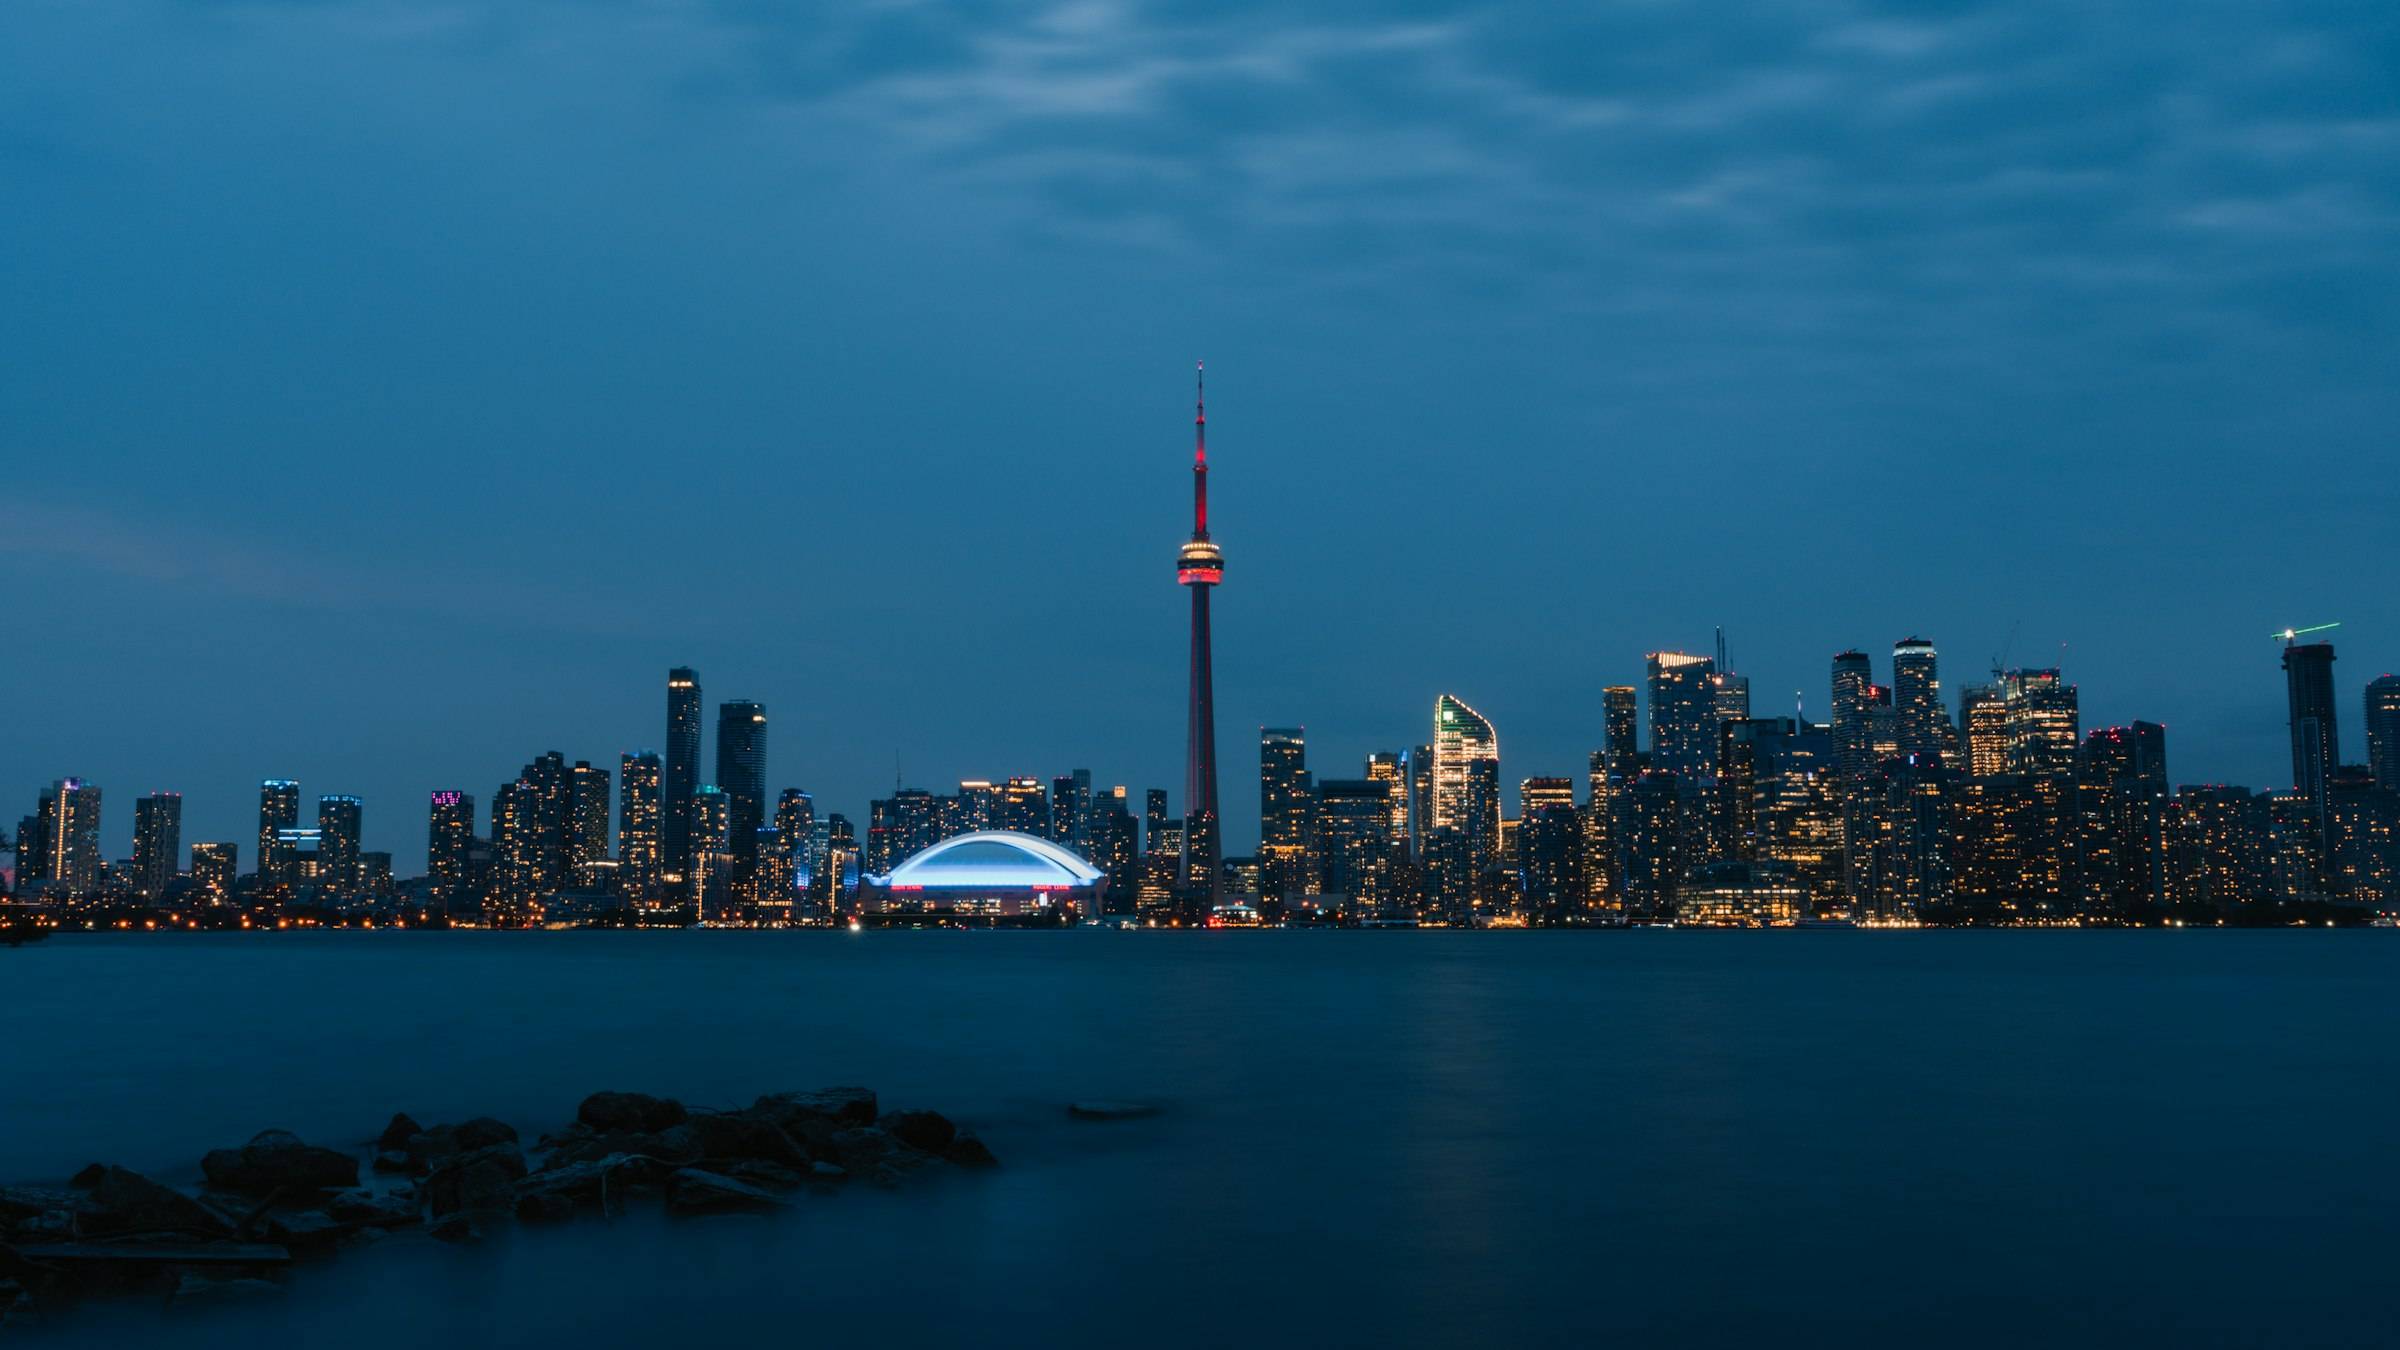
The City of Toronto is the single city created in 1998 when Old Toronto, North York, Scarborough, Etobicoke, East York and York were amalgamated.
TRREB average$1,075,627October 2026
Book a free Gameplan SessionSources: Statistics Canada. Full citations at the foot of the page. Compiled November 2026.
TRREB sales for October 2026, and the 2021 Census housing mix.
What's your home worth?
Start with your address for a rough range on a Toronto home.
TRREB reported 2,184 sales inside the City of Toronto in October 2026, at an average price of $1,075,627 and a median of $835,000. The space between the average and the median comes from the mix of homes that changed hands. Condo apartments were the largest group with 949 sales at an average of $659,214, while 741 detached houses averaged $1,603,886. The MLS Home Price Index composite benchmark for the city was $908,800, which is 3.60% lower than a year earlier. Homes sold for 98% of list price on average and listings that sold had been on the market for an average of 30 days.
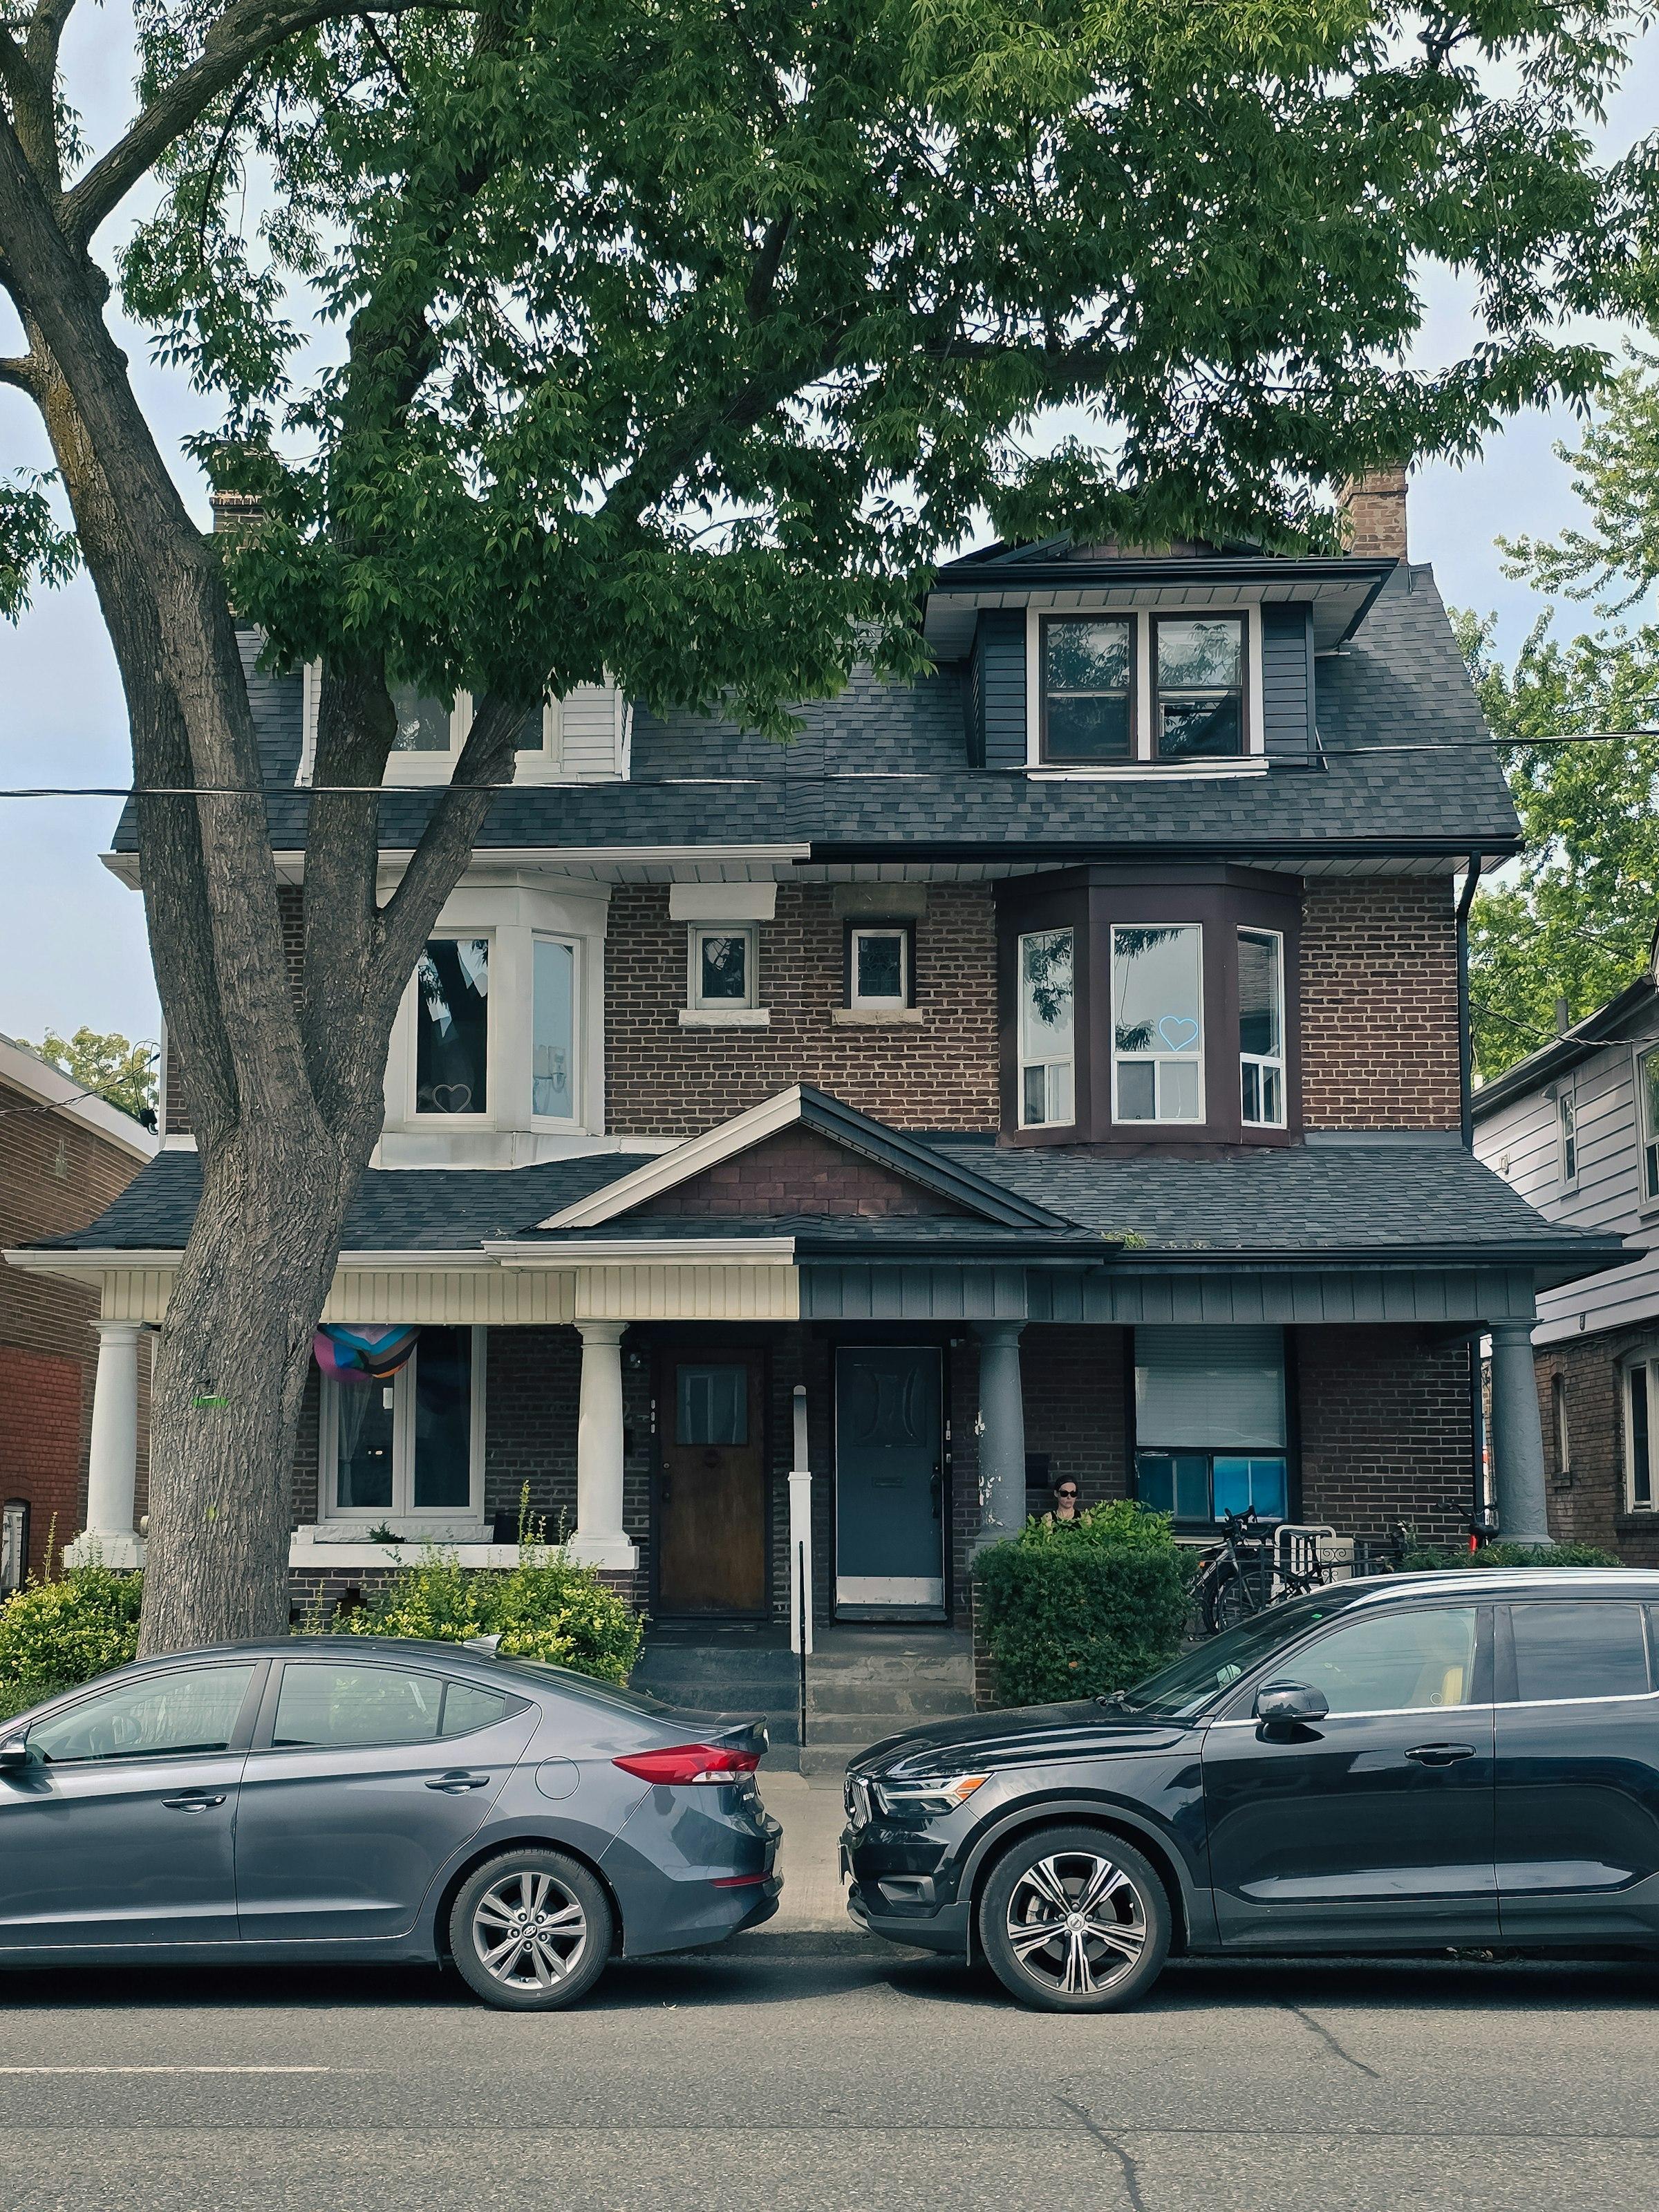
Apartments in buildings of five or more storeys are the most common home in Toronto at 46.7% of occupied dwellings, well ahead of single-detached houses at 23.3%. Low-rise apartments add another 14.0%, and semis, row houses and duplex units fill most of what is left. Ownership is close to an even split, with 51.9% of households owning. The averages hide big differences between districts. In the two downtown wards covering the core, only 0.5% of homes are detached houses, while in Scarborough's six wards the figure is 37.2% and in Etobicoke's three wards it is 34.7%. North York's five core wards sit in between, at 19.5% detached and 52.6% in buildings of five or more storeys.
Stations, rapid transit and highways.
Boundaries change. Confirm your address with the board before you buy.
Parks, neighbourhoods and who Toronto suits.
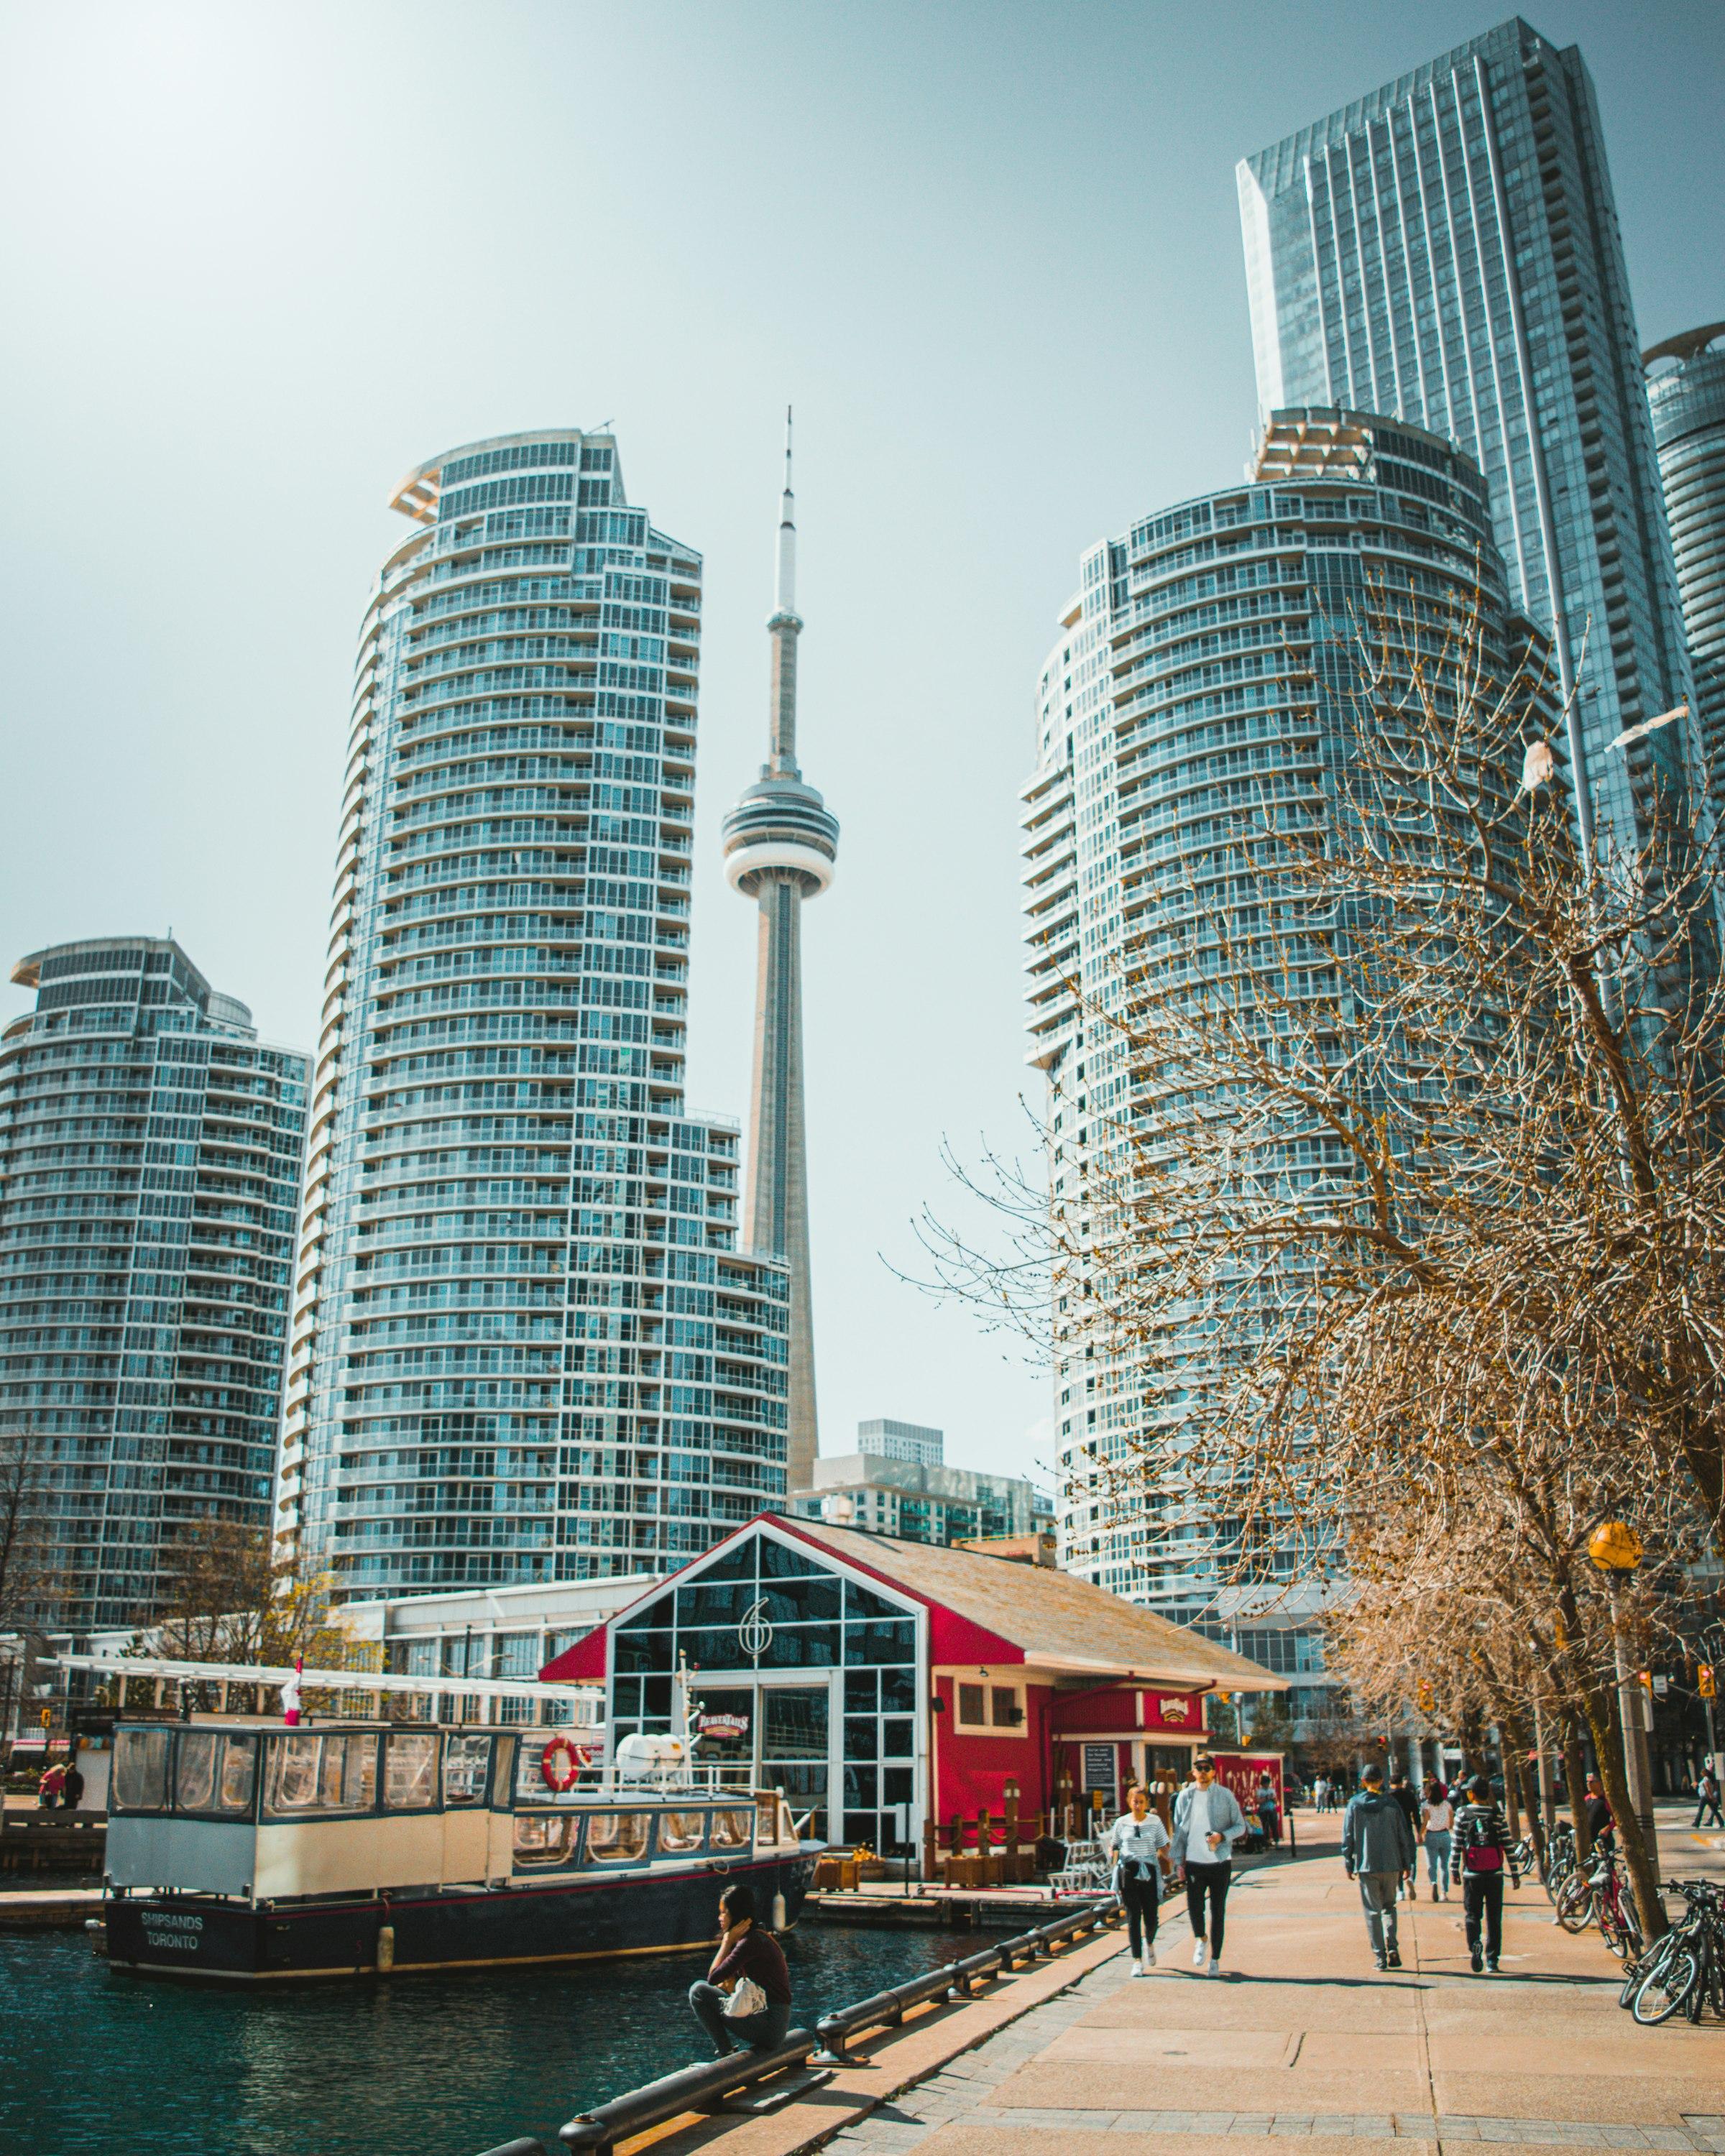
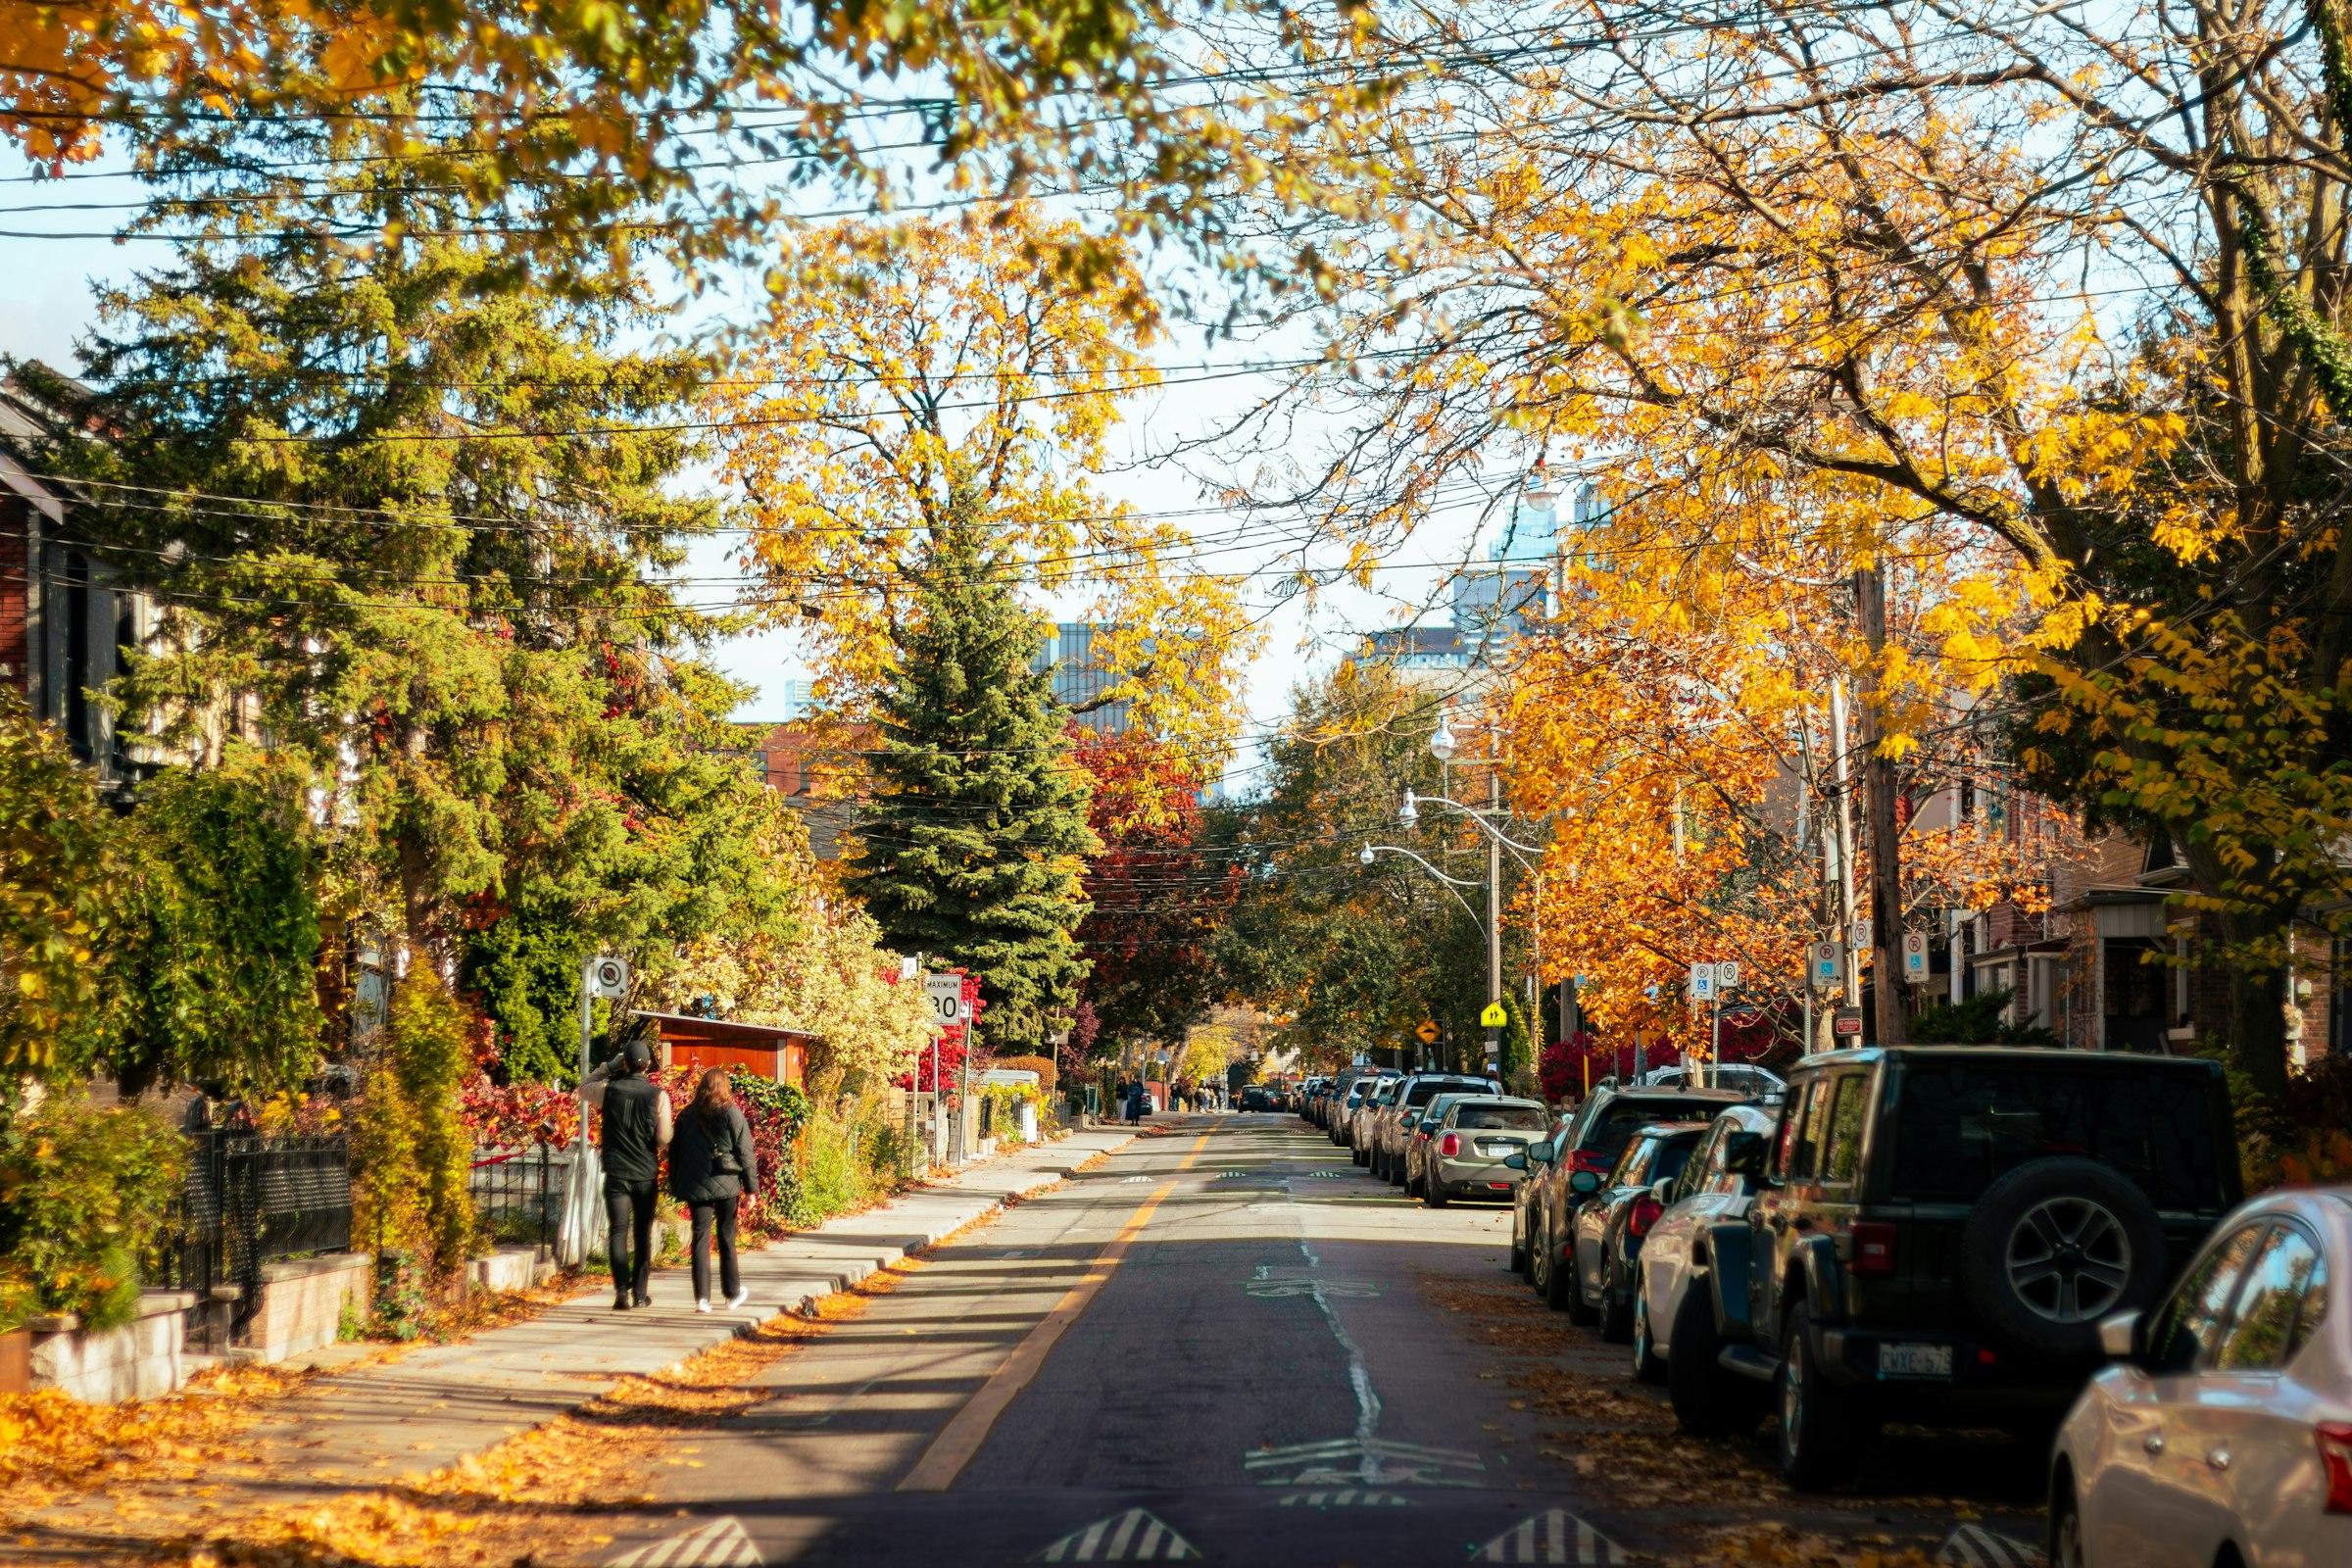
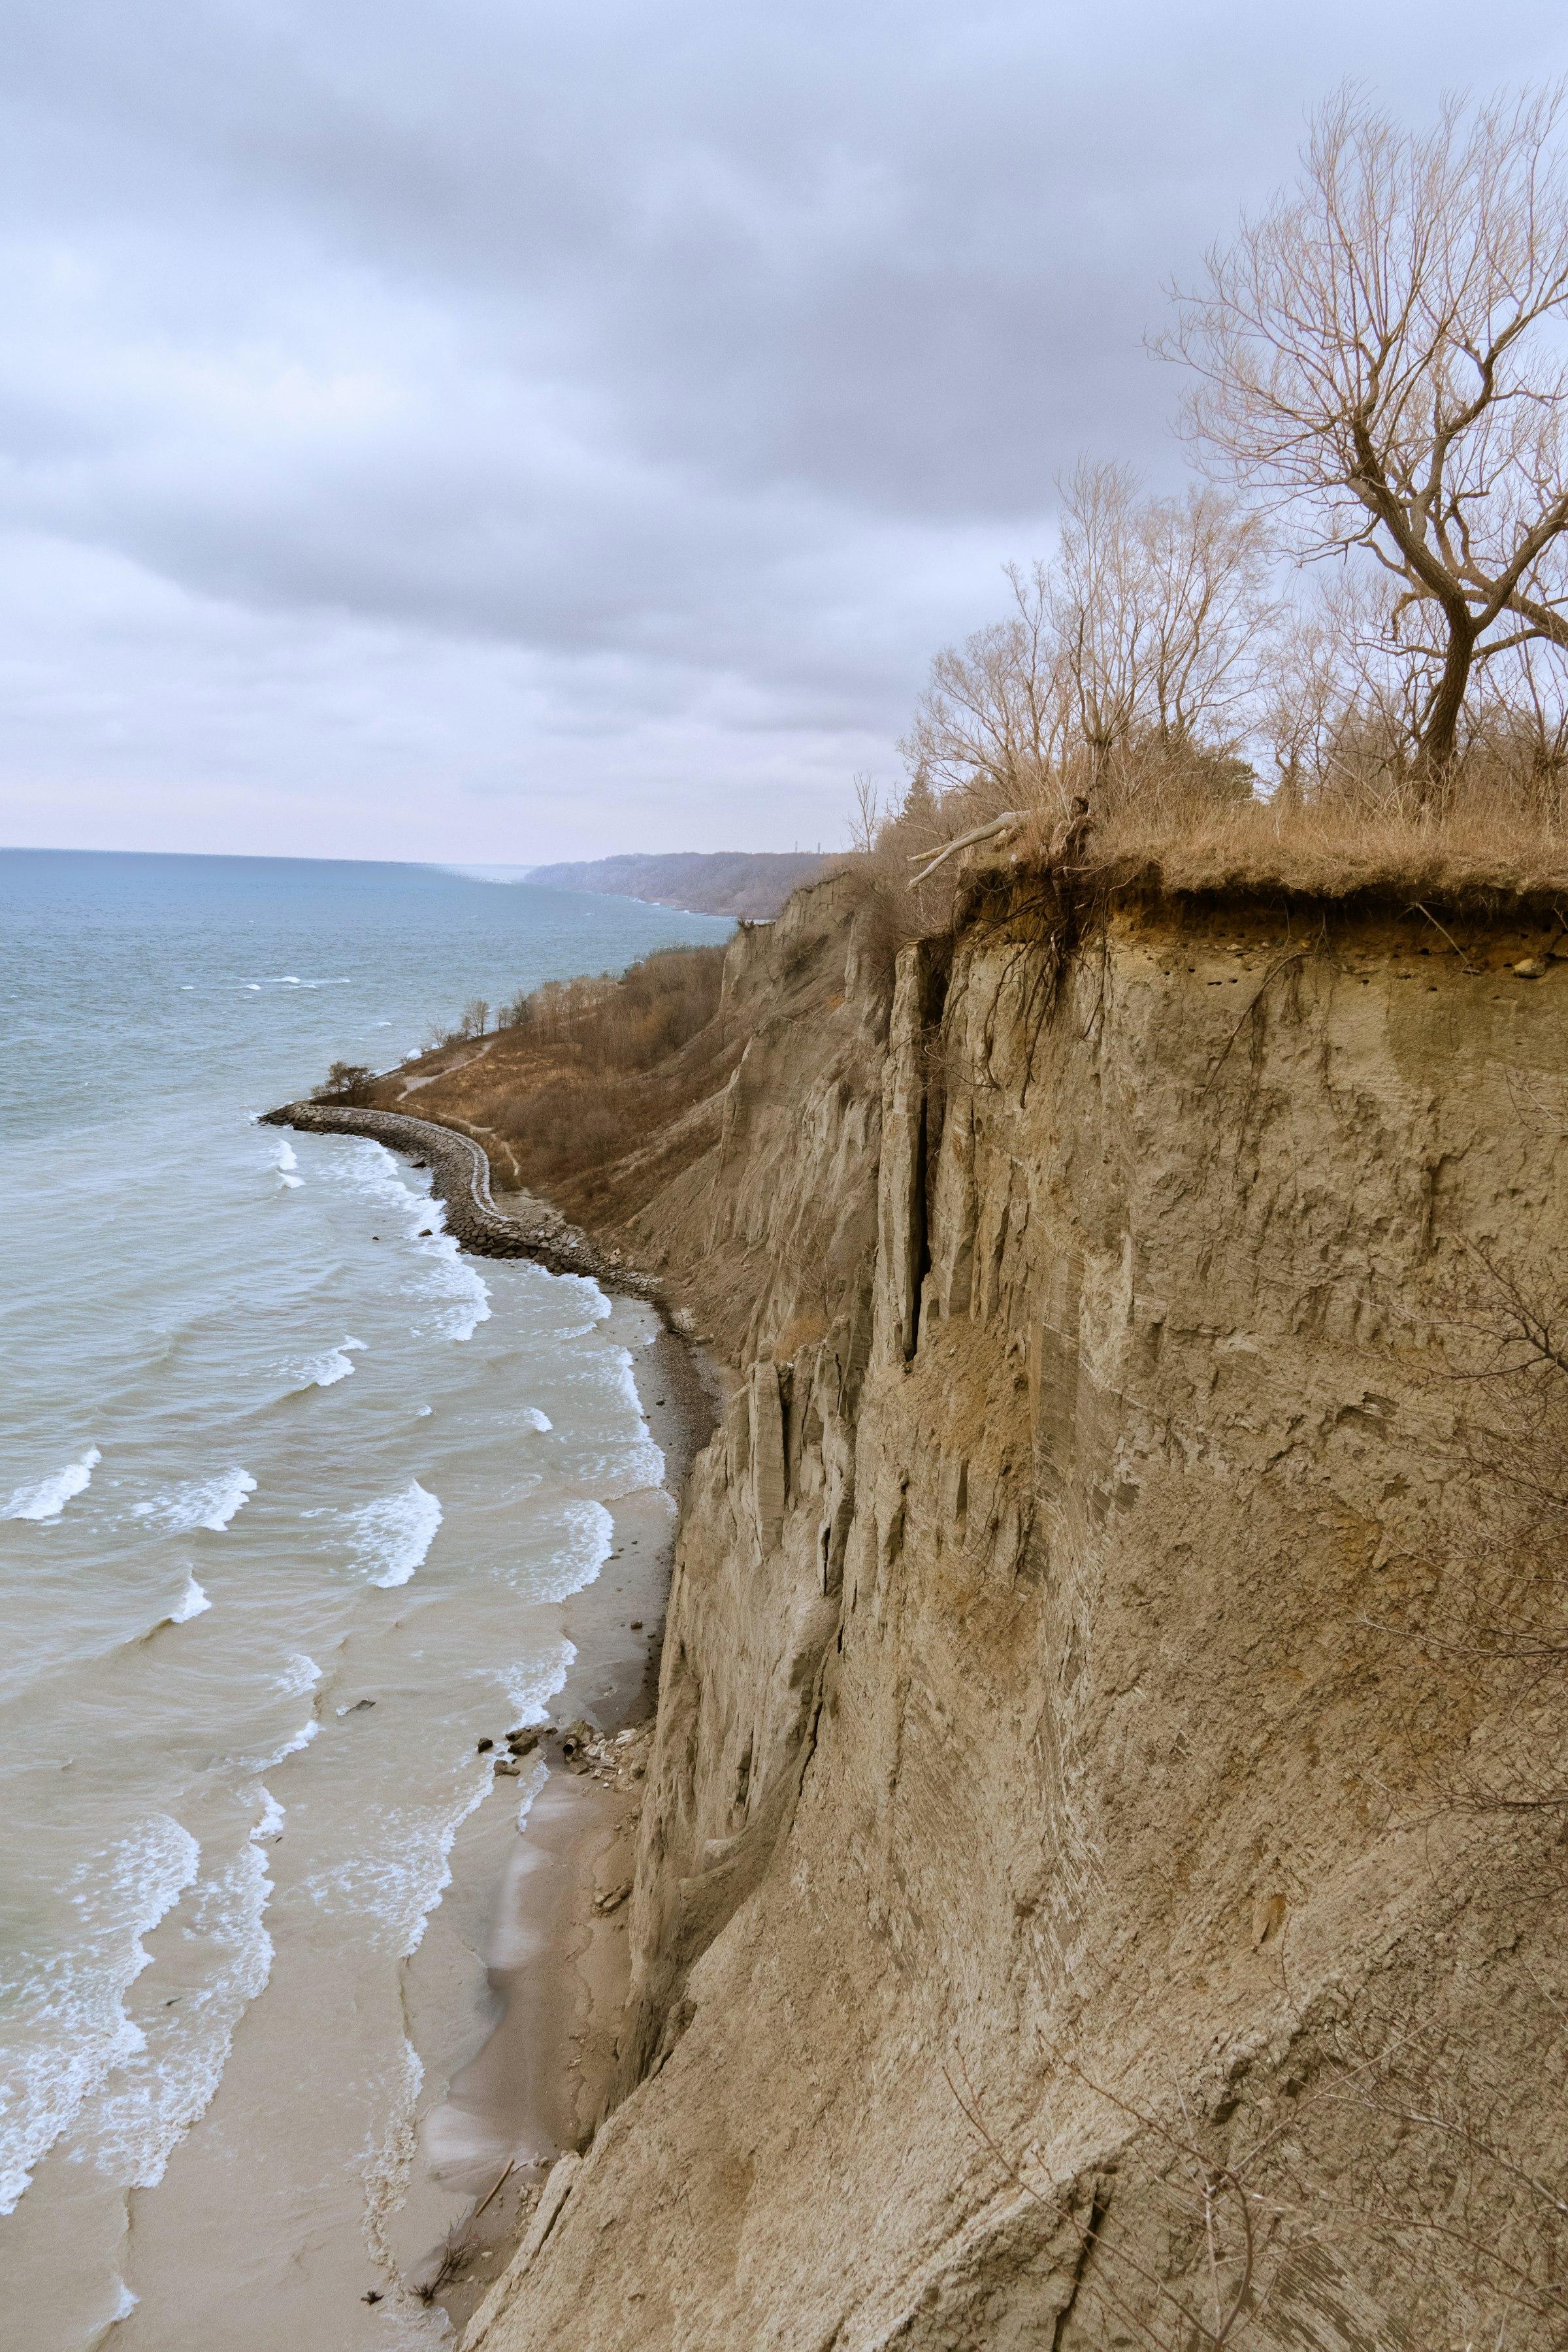
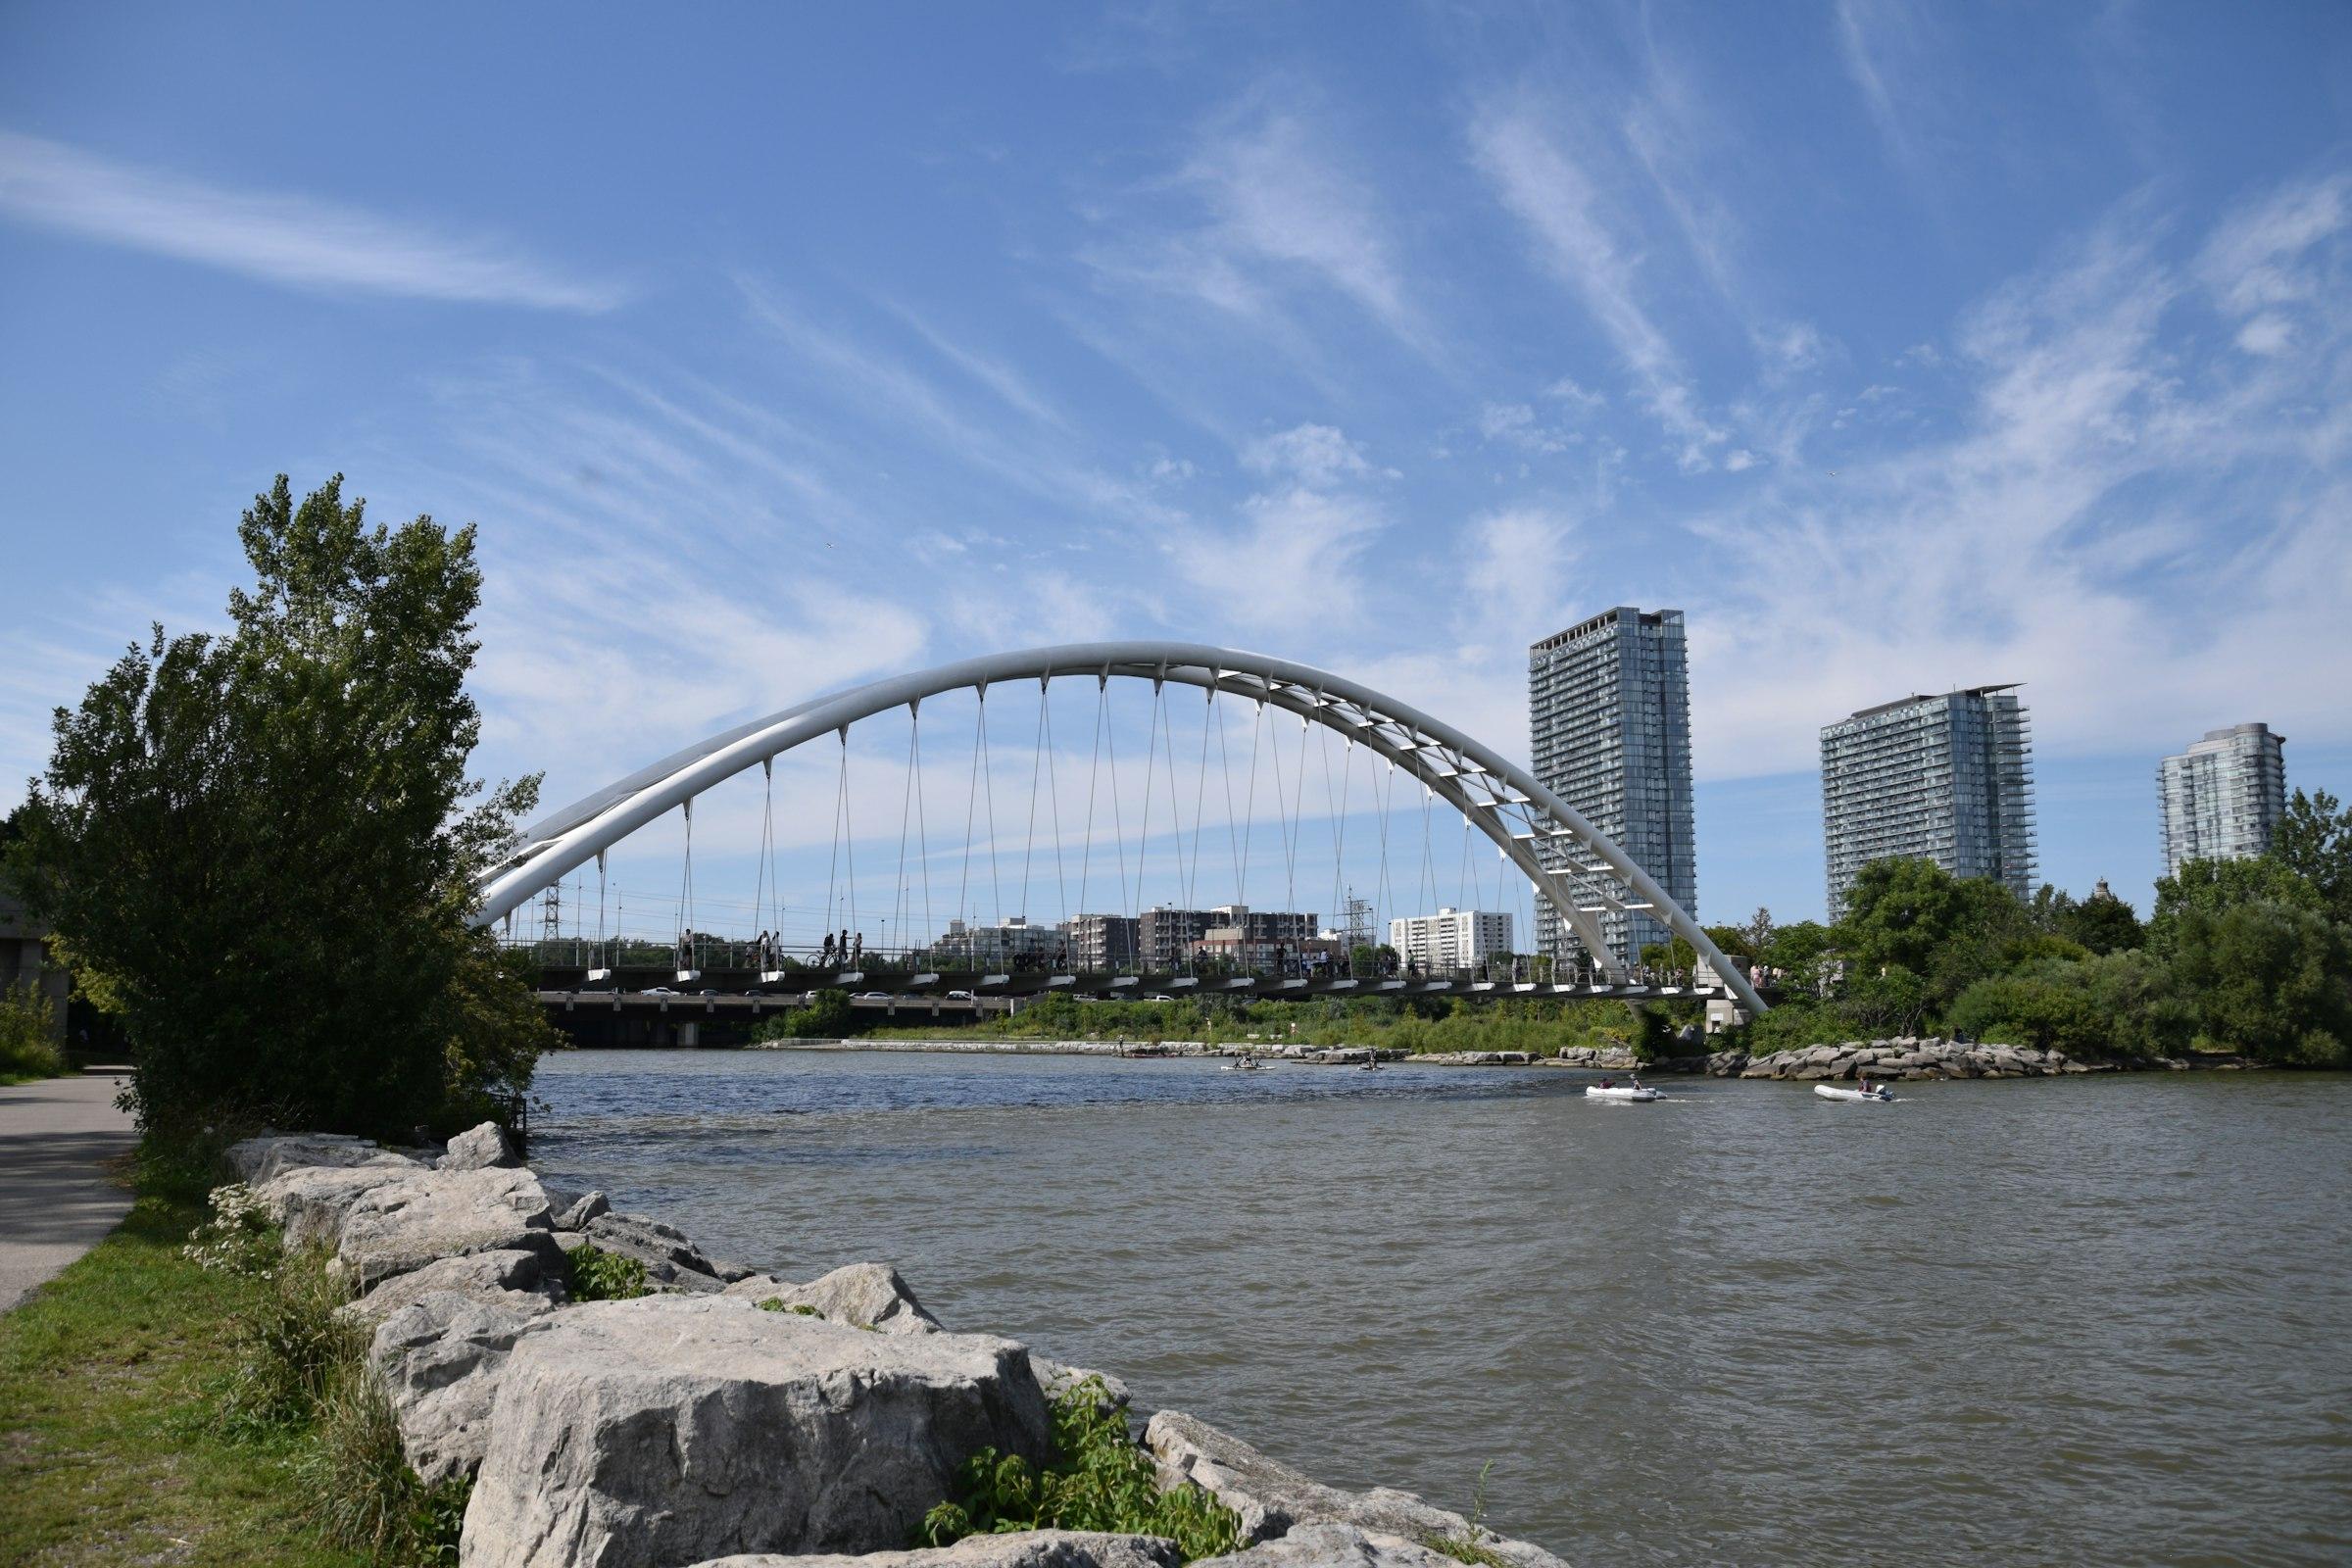
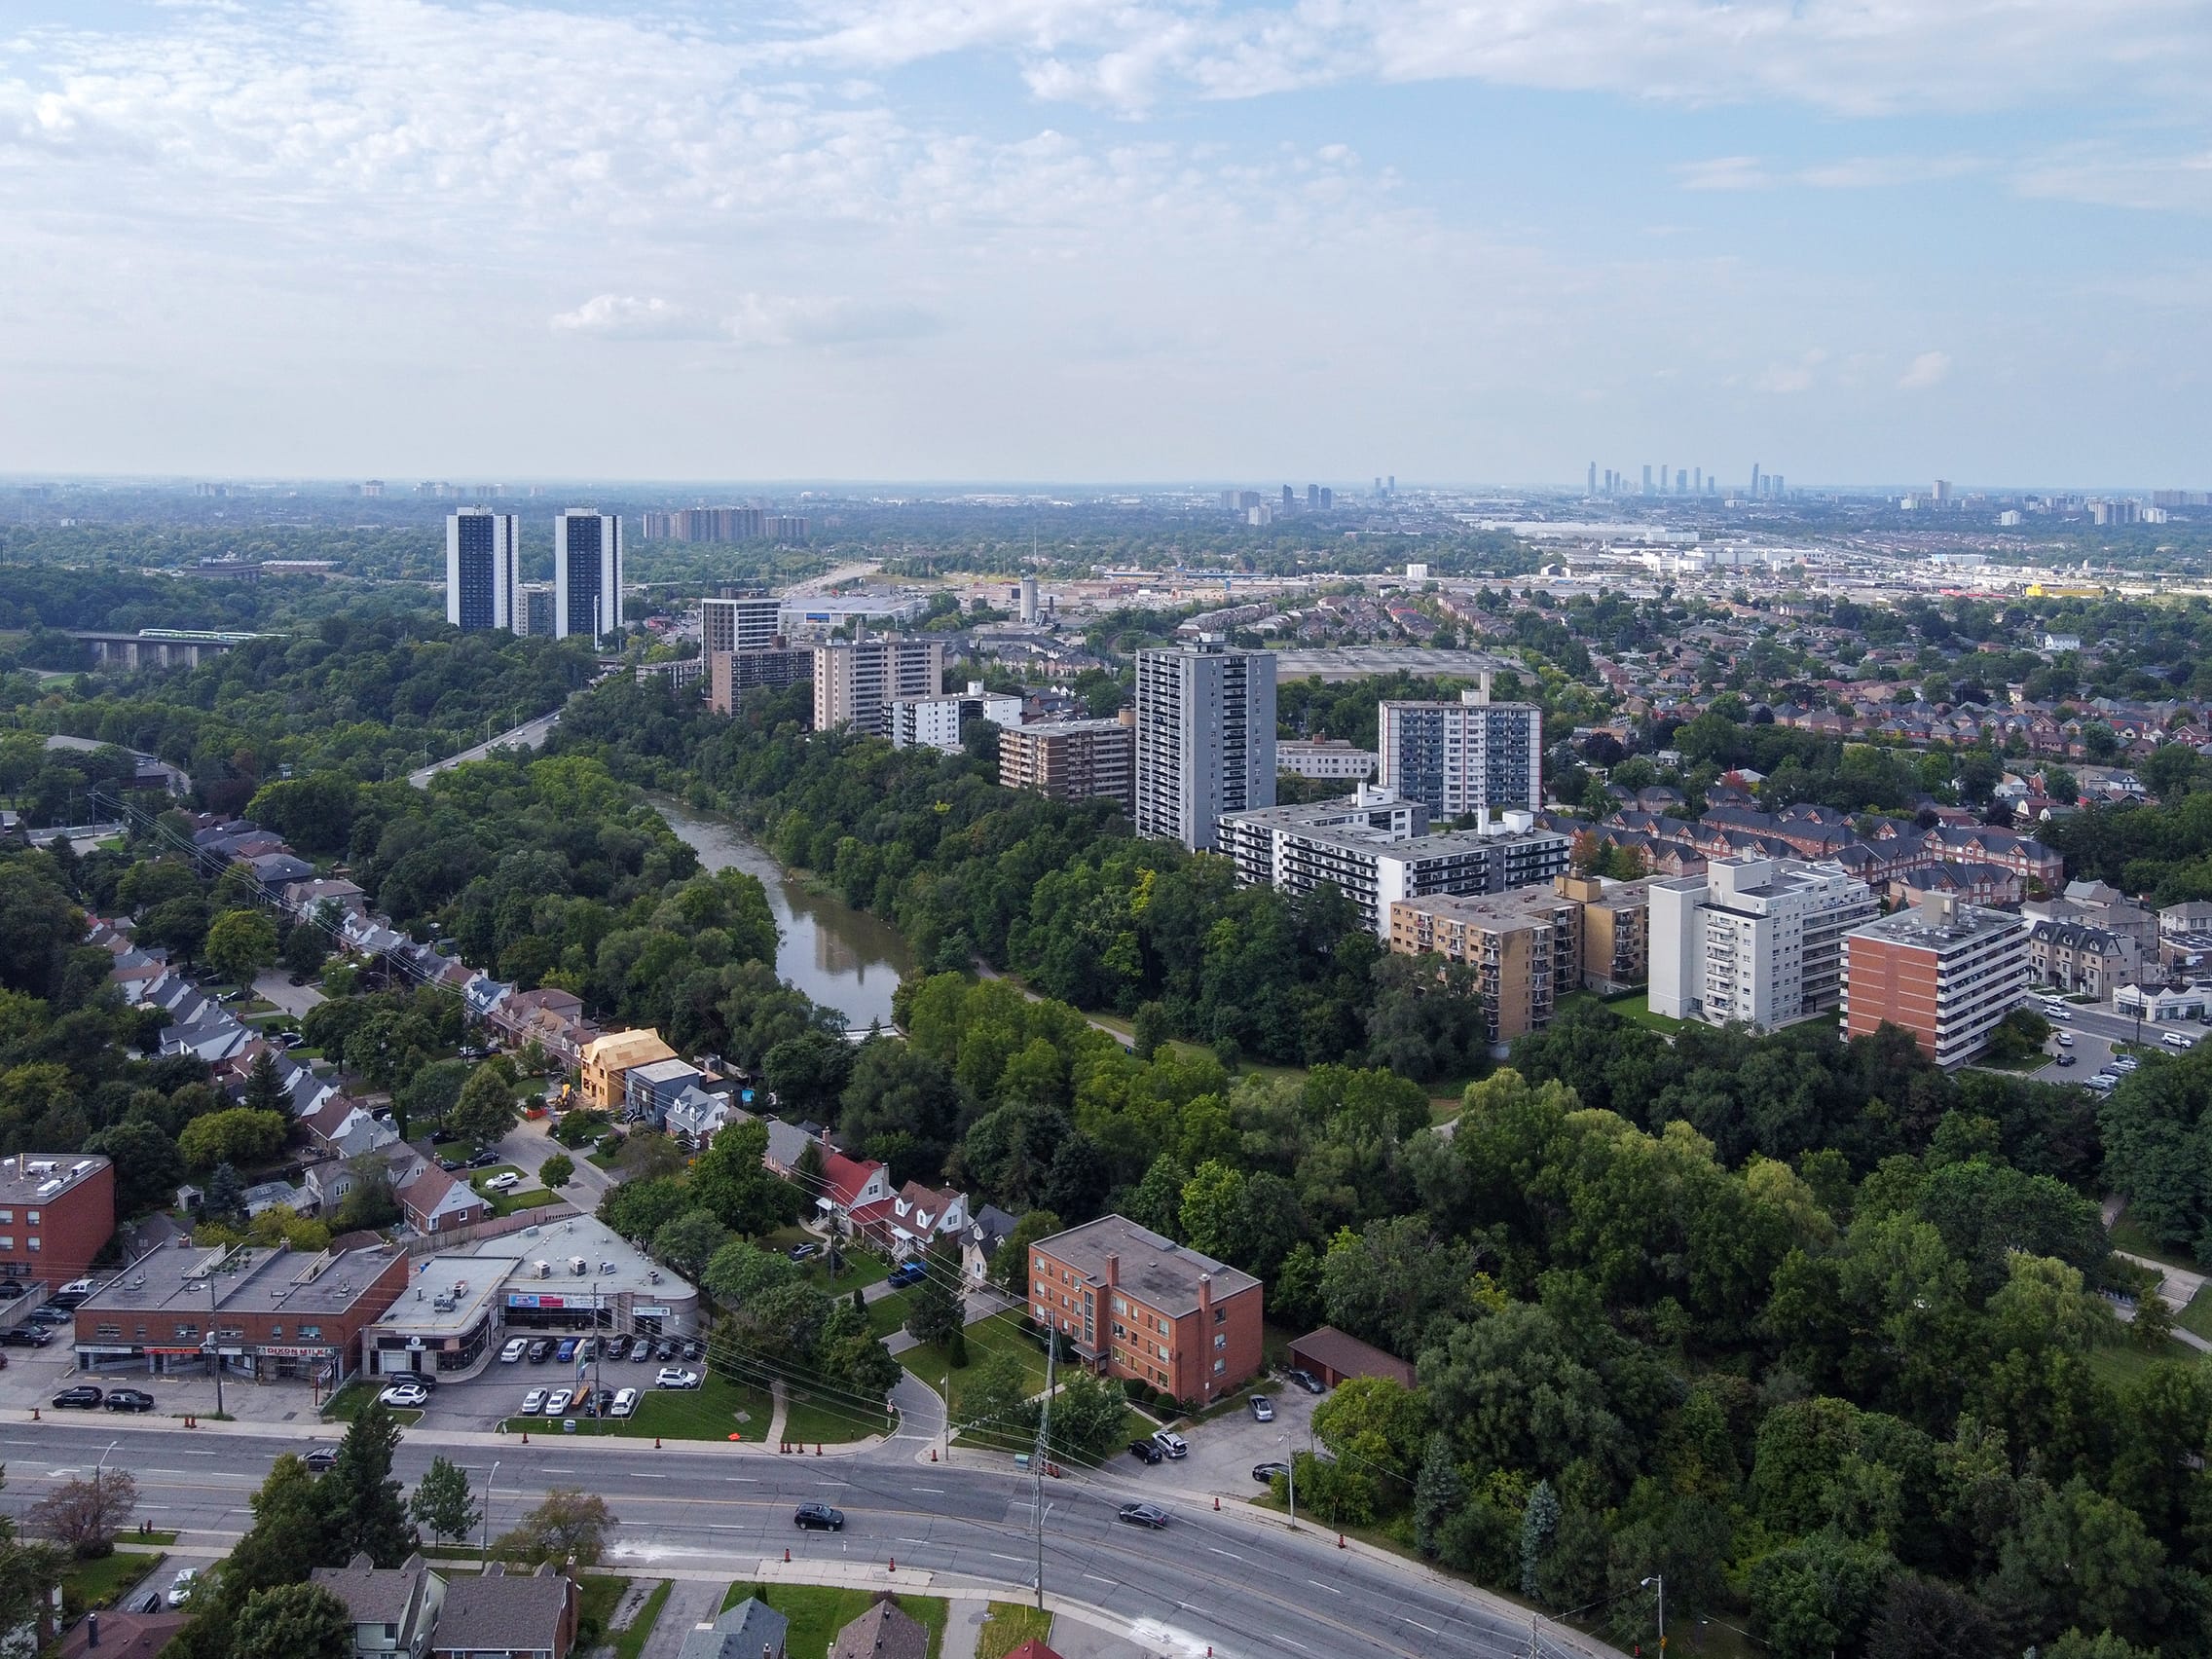
The City of Toronto is the single city created in 1998 when Old Toronto, North York, Scarborough, Etobicoke, East York and York were amalgamated. The 2021 Census counted 2,794,356 people on 631 square kilometres, and close to half of residents in private households are immigrants. For a buyer it works less like one market and more like several, ranging from downtown condo towers to postwar bungalow streets in the suburbs.
Toronto's day-to-day character depends on which district you live in, and each former city still has its own centre. North York has North York Centre and two of the city's largest malls, Yorkdale and Fairview. Scarborough has Scarborough Town Centre beside its former civic centre, plus the Toronto Zoo and the Rouge River valley. Etobicoke has a run of lakeshore main streets in Mimico, New Toronto and Long Branch. The downtown core holds the Financial District, the Entertainment District, St. Lawrence Market and the PATH underground walkway. Across the city, 41.9% of residents learned a language other than English or French first, which shows up in the shops, places of worship and community groups found in every district.
Get a custom list of homes in Toronto that match your budget and must-haves, sent to you as they come up.
Still unsure? Call or text 437-525-2544.
TRREB reported an average of $1,075,627 and a median of $835,000 for the City of Toronto across 2,184 sales in October 2026. Detached houses averaged $1,603,886 and condo apartments averaged $659,214.
It is nearly even. The 2021 Census counted 602,925 owner households and 557,970 renter households, so 51.9% own. Renting is far more common downtown, where 63.6% of households in Wards 10 and 13 rent.
Based on City of Toronto ward profiles from the 2021 Census, single-detached houses make up 37.2% of homes in Scarborough's six wards and 34.7% in Etobicoke's three wards, compared with 23.3% citywide and 0.5% in the two downtown wards.
The census count rose from 2,731,571 in 2016 to 2,794,356 in 2021, an increase of 2.3%. Growth was uneven: the two downtown wards grew 18.0% over the same period while Scarborough's wards were essentially flat.
Photos are stock or Creative Commons images for illustration, not homes listed or sold by Ishwar Garg. Photo credits.
Market figures are averages for the period shown and vary by property type and street. They are not an appraisal of any home. Try the home value calculator for a rough range on a specific property.
Land transfer tax, closing costs and first-time buyer incentives, with official sources.
Buying
Ontario and Toronto land transfer tax rates, first-time buyer refunds, and worked examples at $700K, $1M and $1.3M, with every step of the math shown.
Updated 6 min read
Buying
Every closing cost a GTA buyer pays, from land transfer tax and PST on default insurance to title insurance and adjustments, with official sources.
Updated 6 min read
Buying
FHSA, the RRSP Home Buyers' Plan, land transfer tax refunds, GST/HST rebates and down payment rules for GTA first-time buyers, with official sources.
Updated 9 min read
One free session to check budget, commute and the homes worth seeing.
Or call 437-525-2544